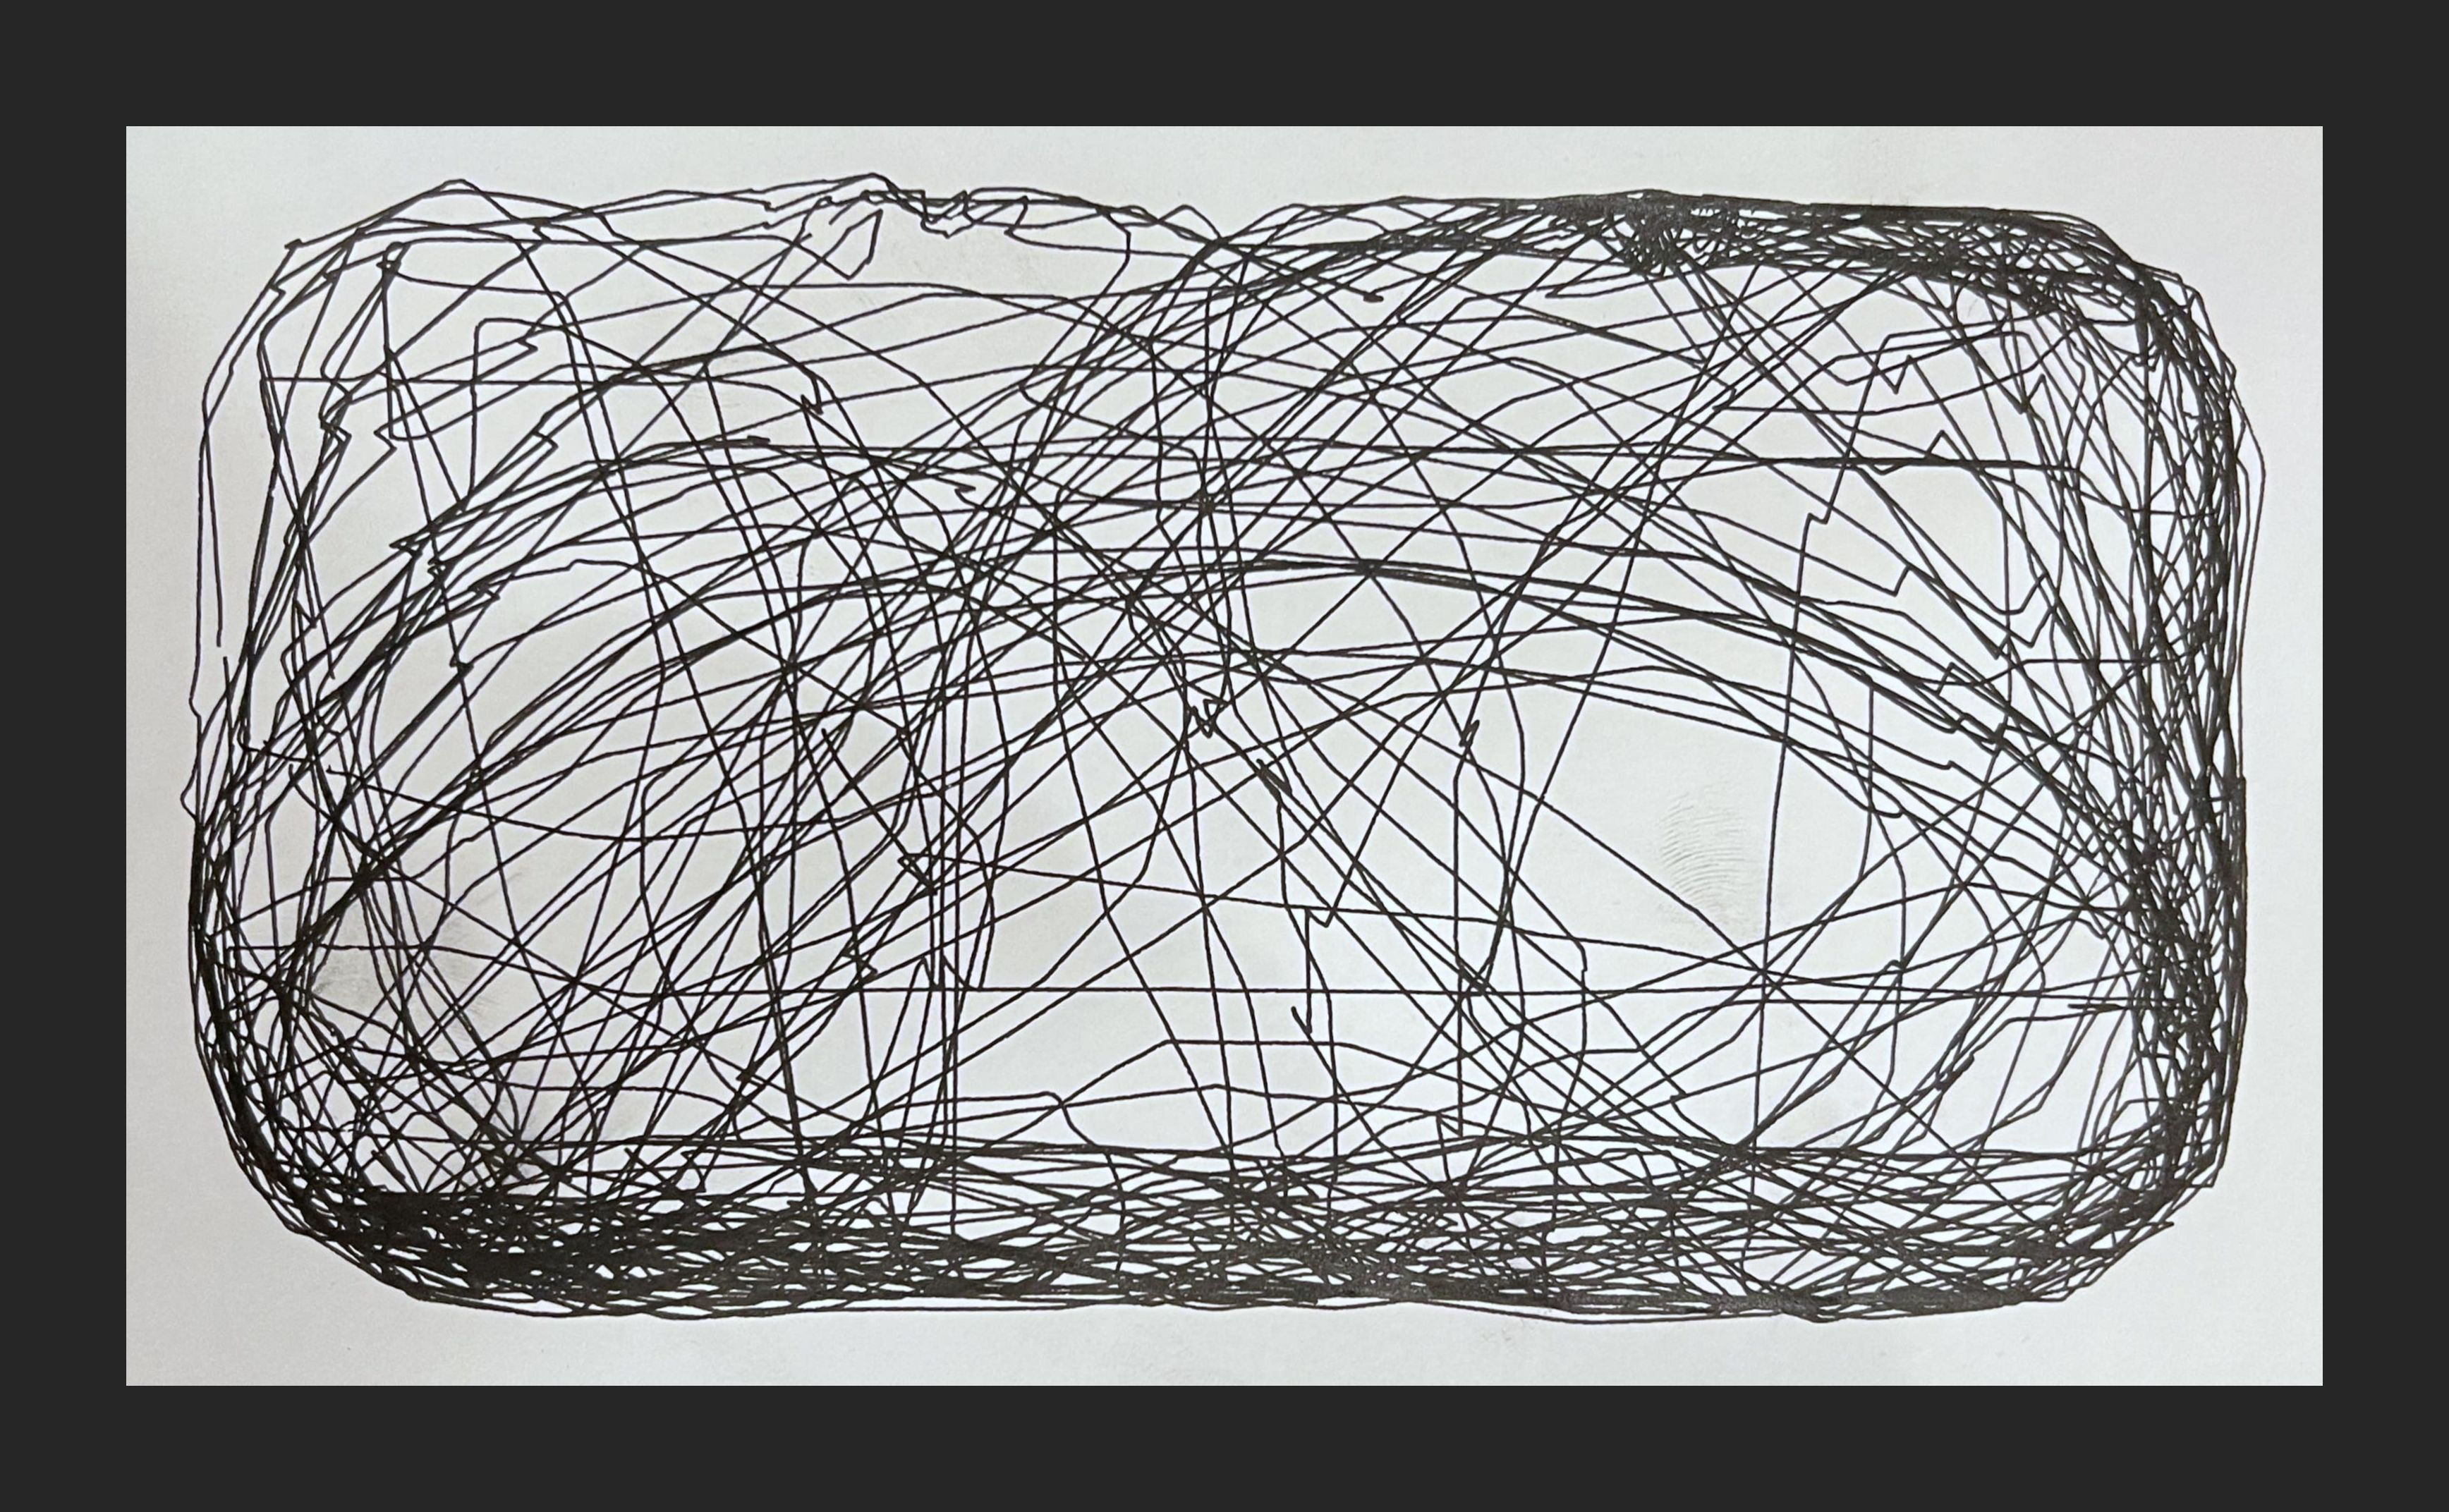
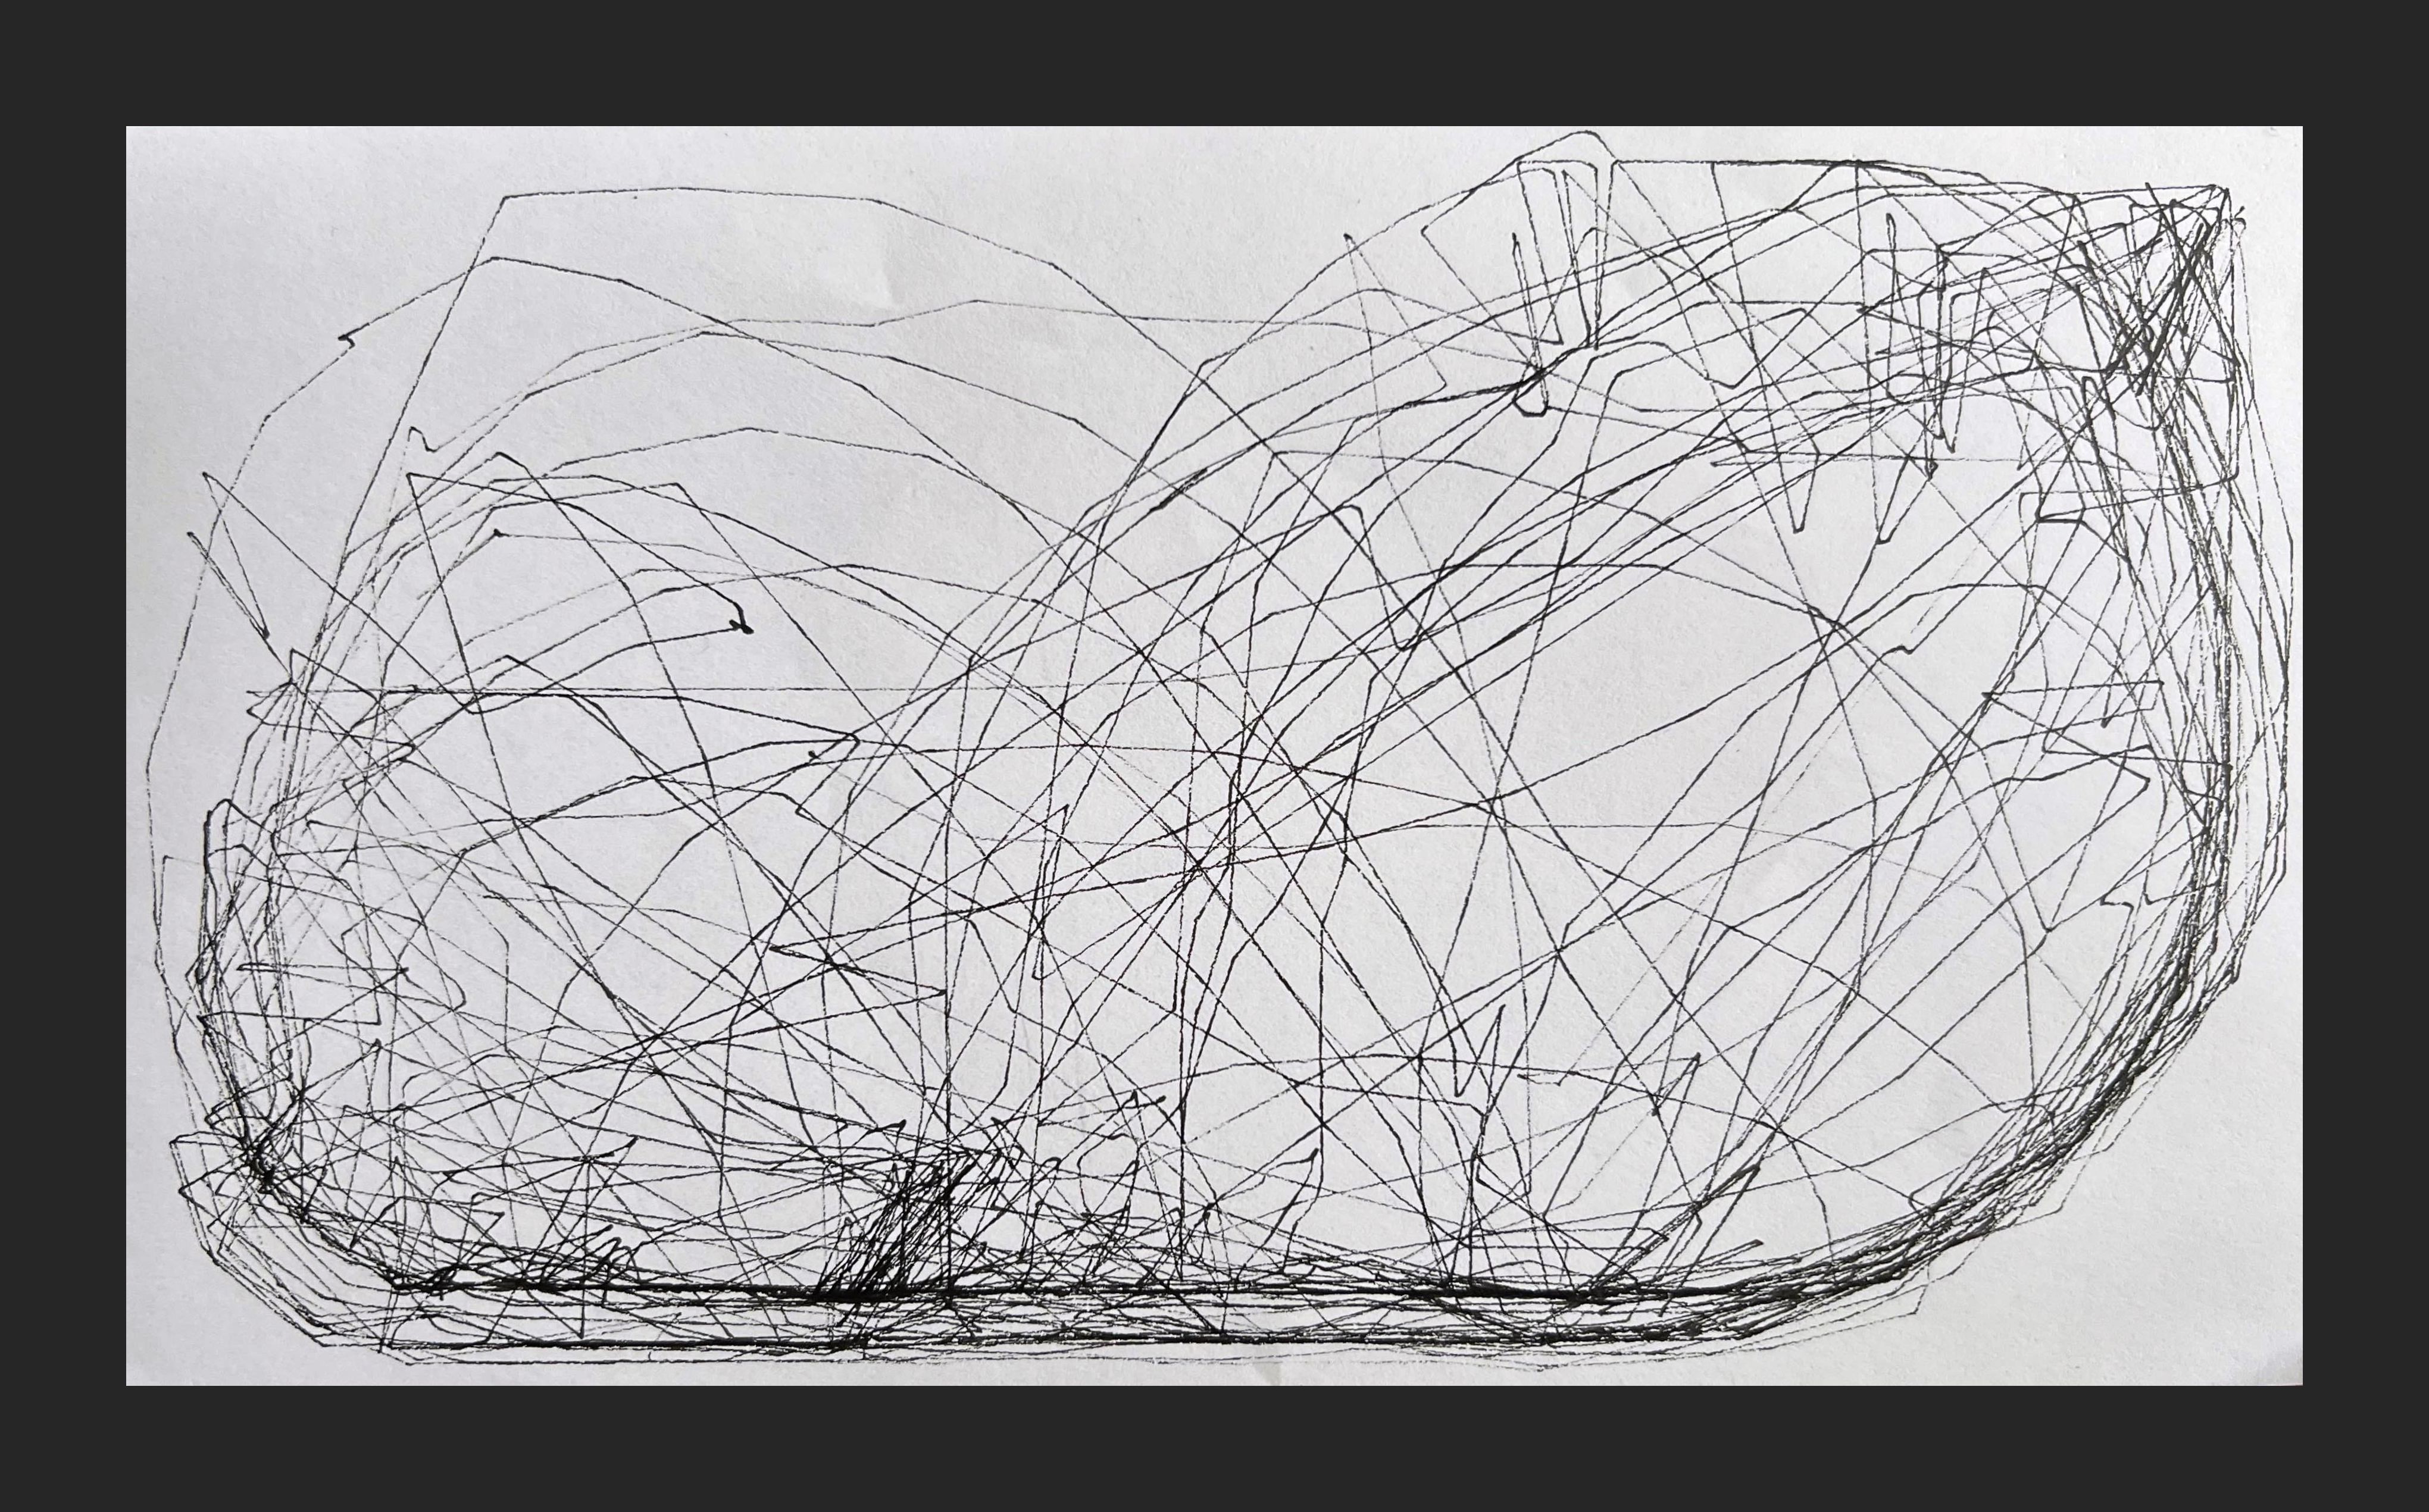
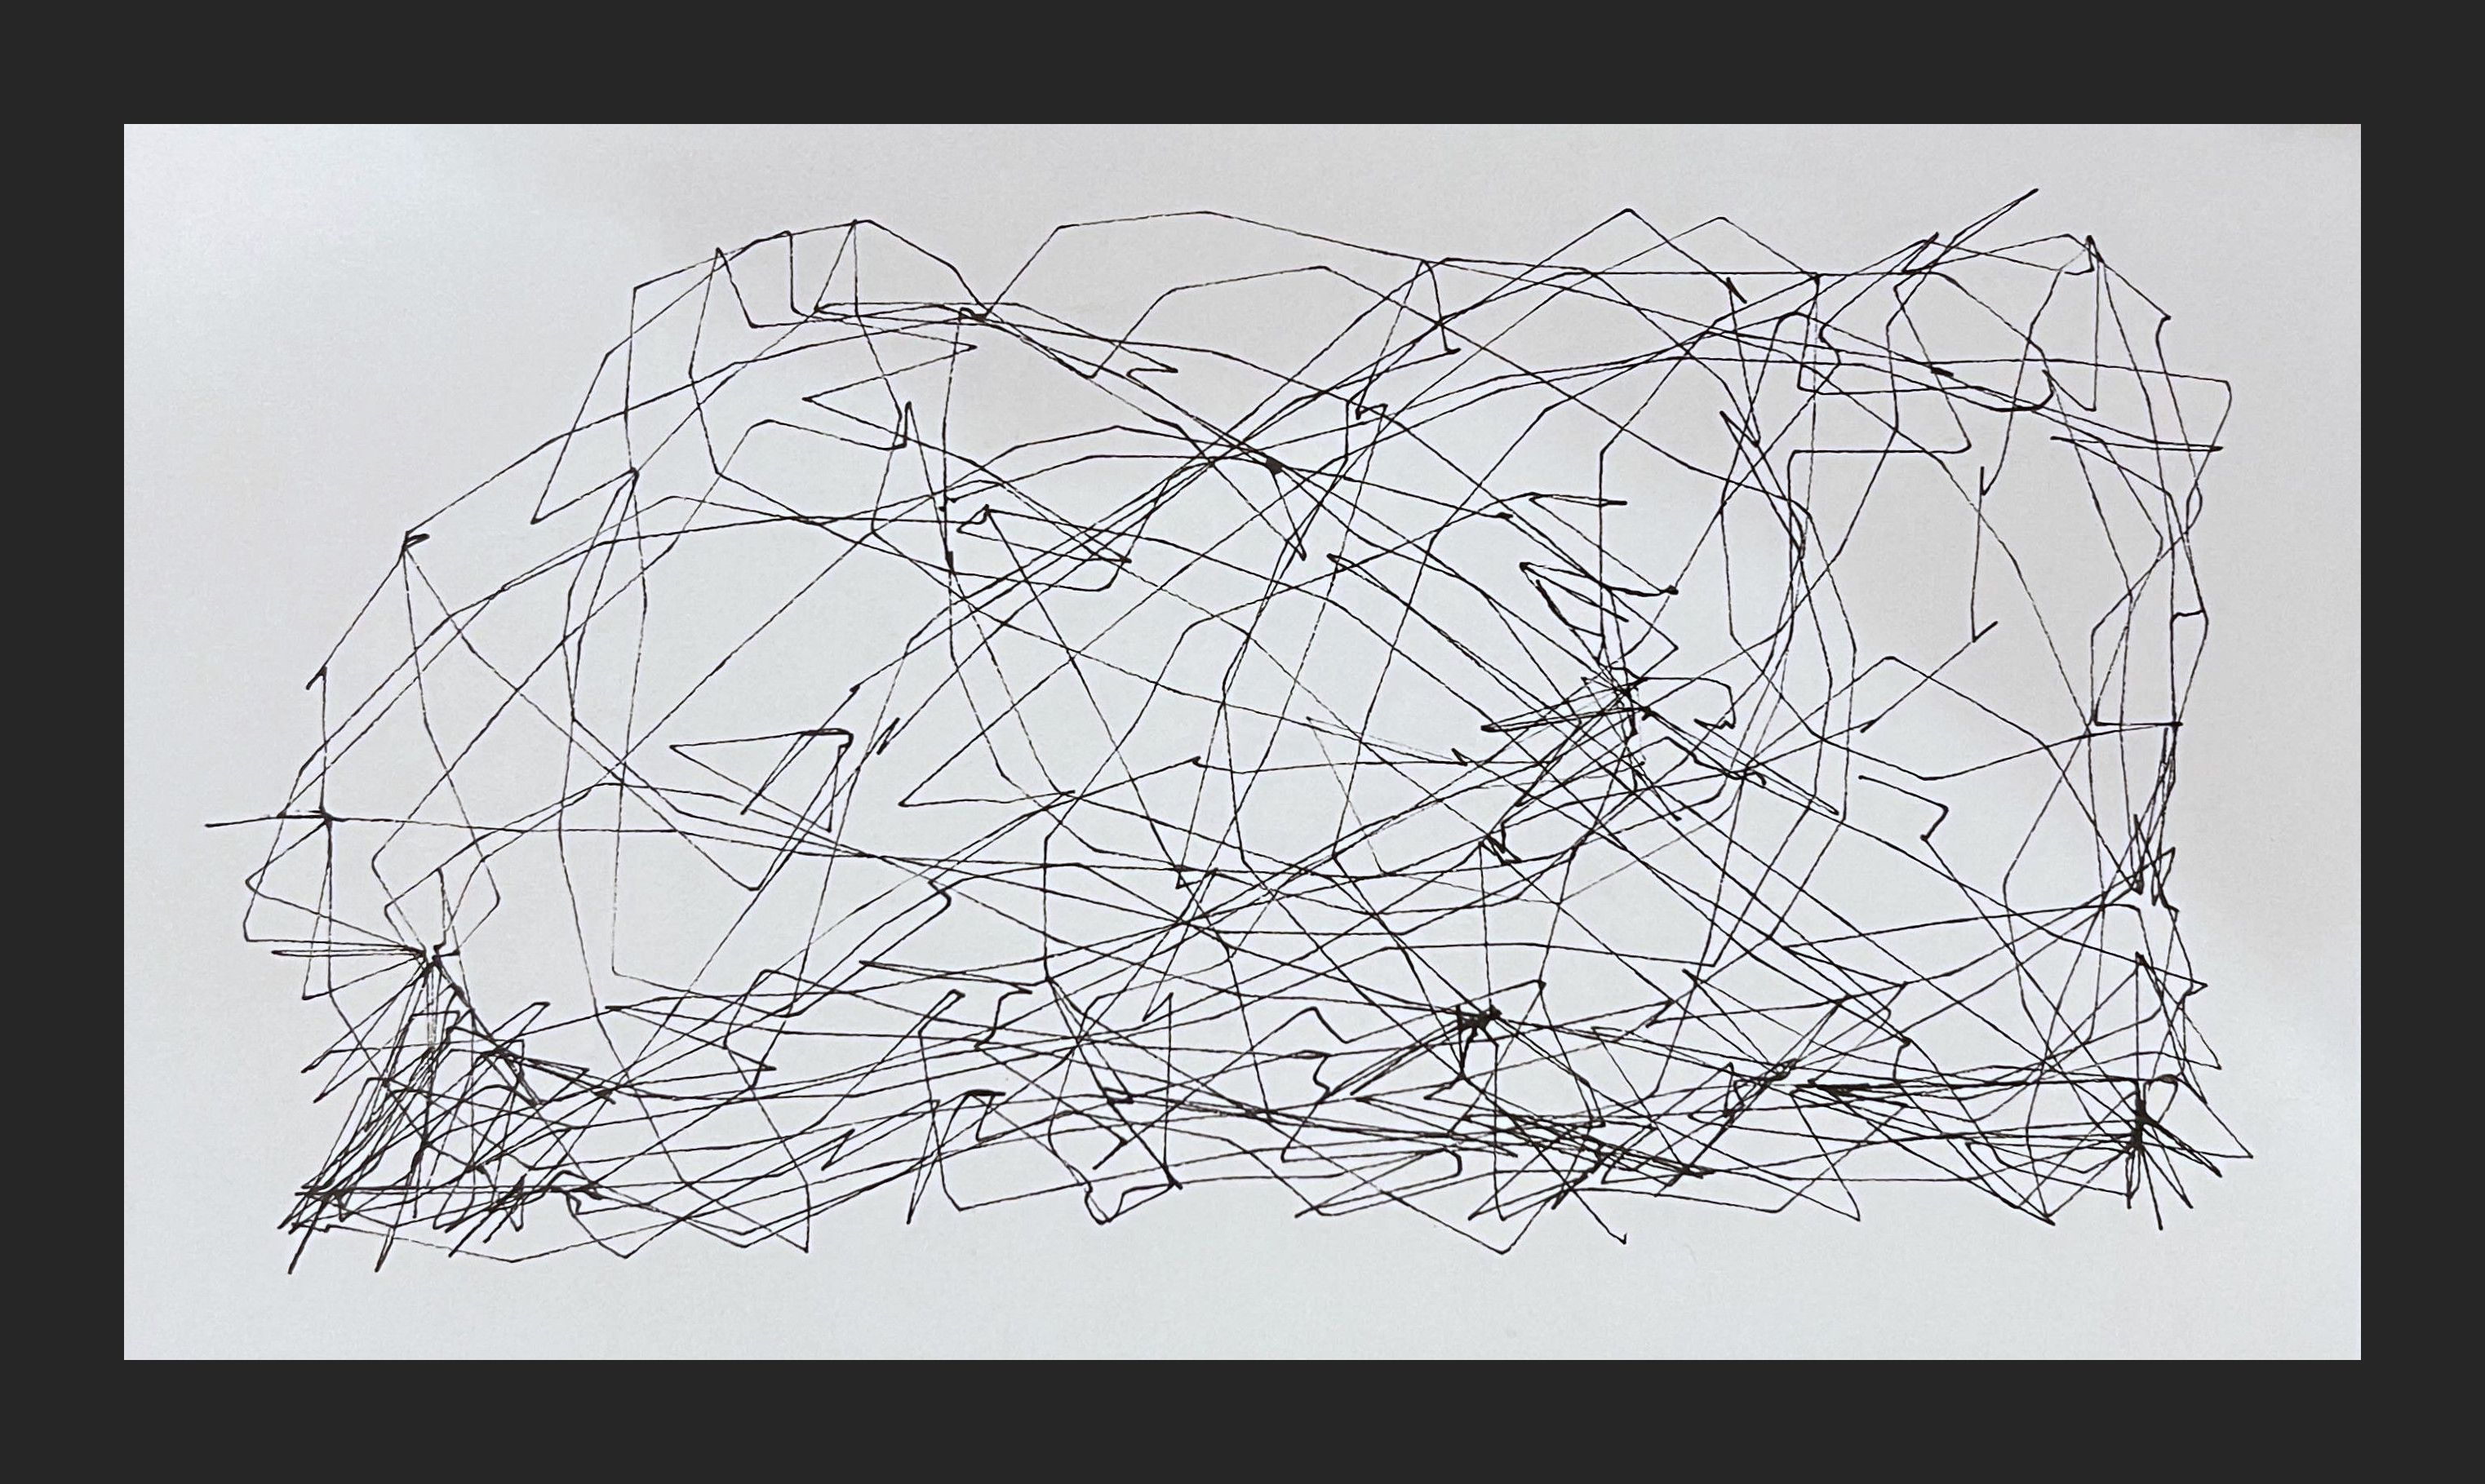
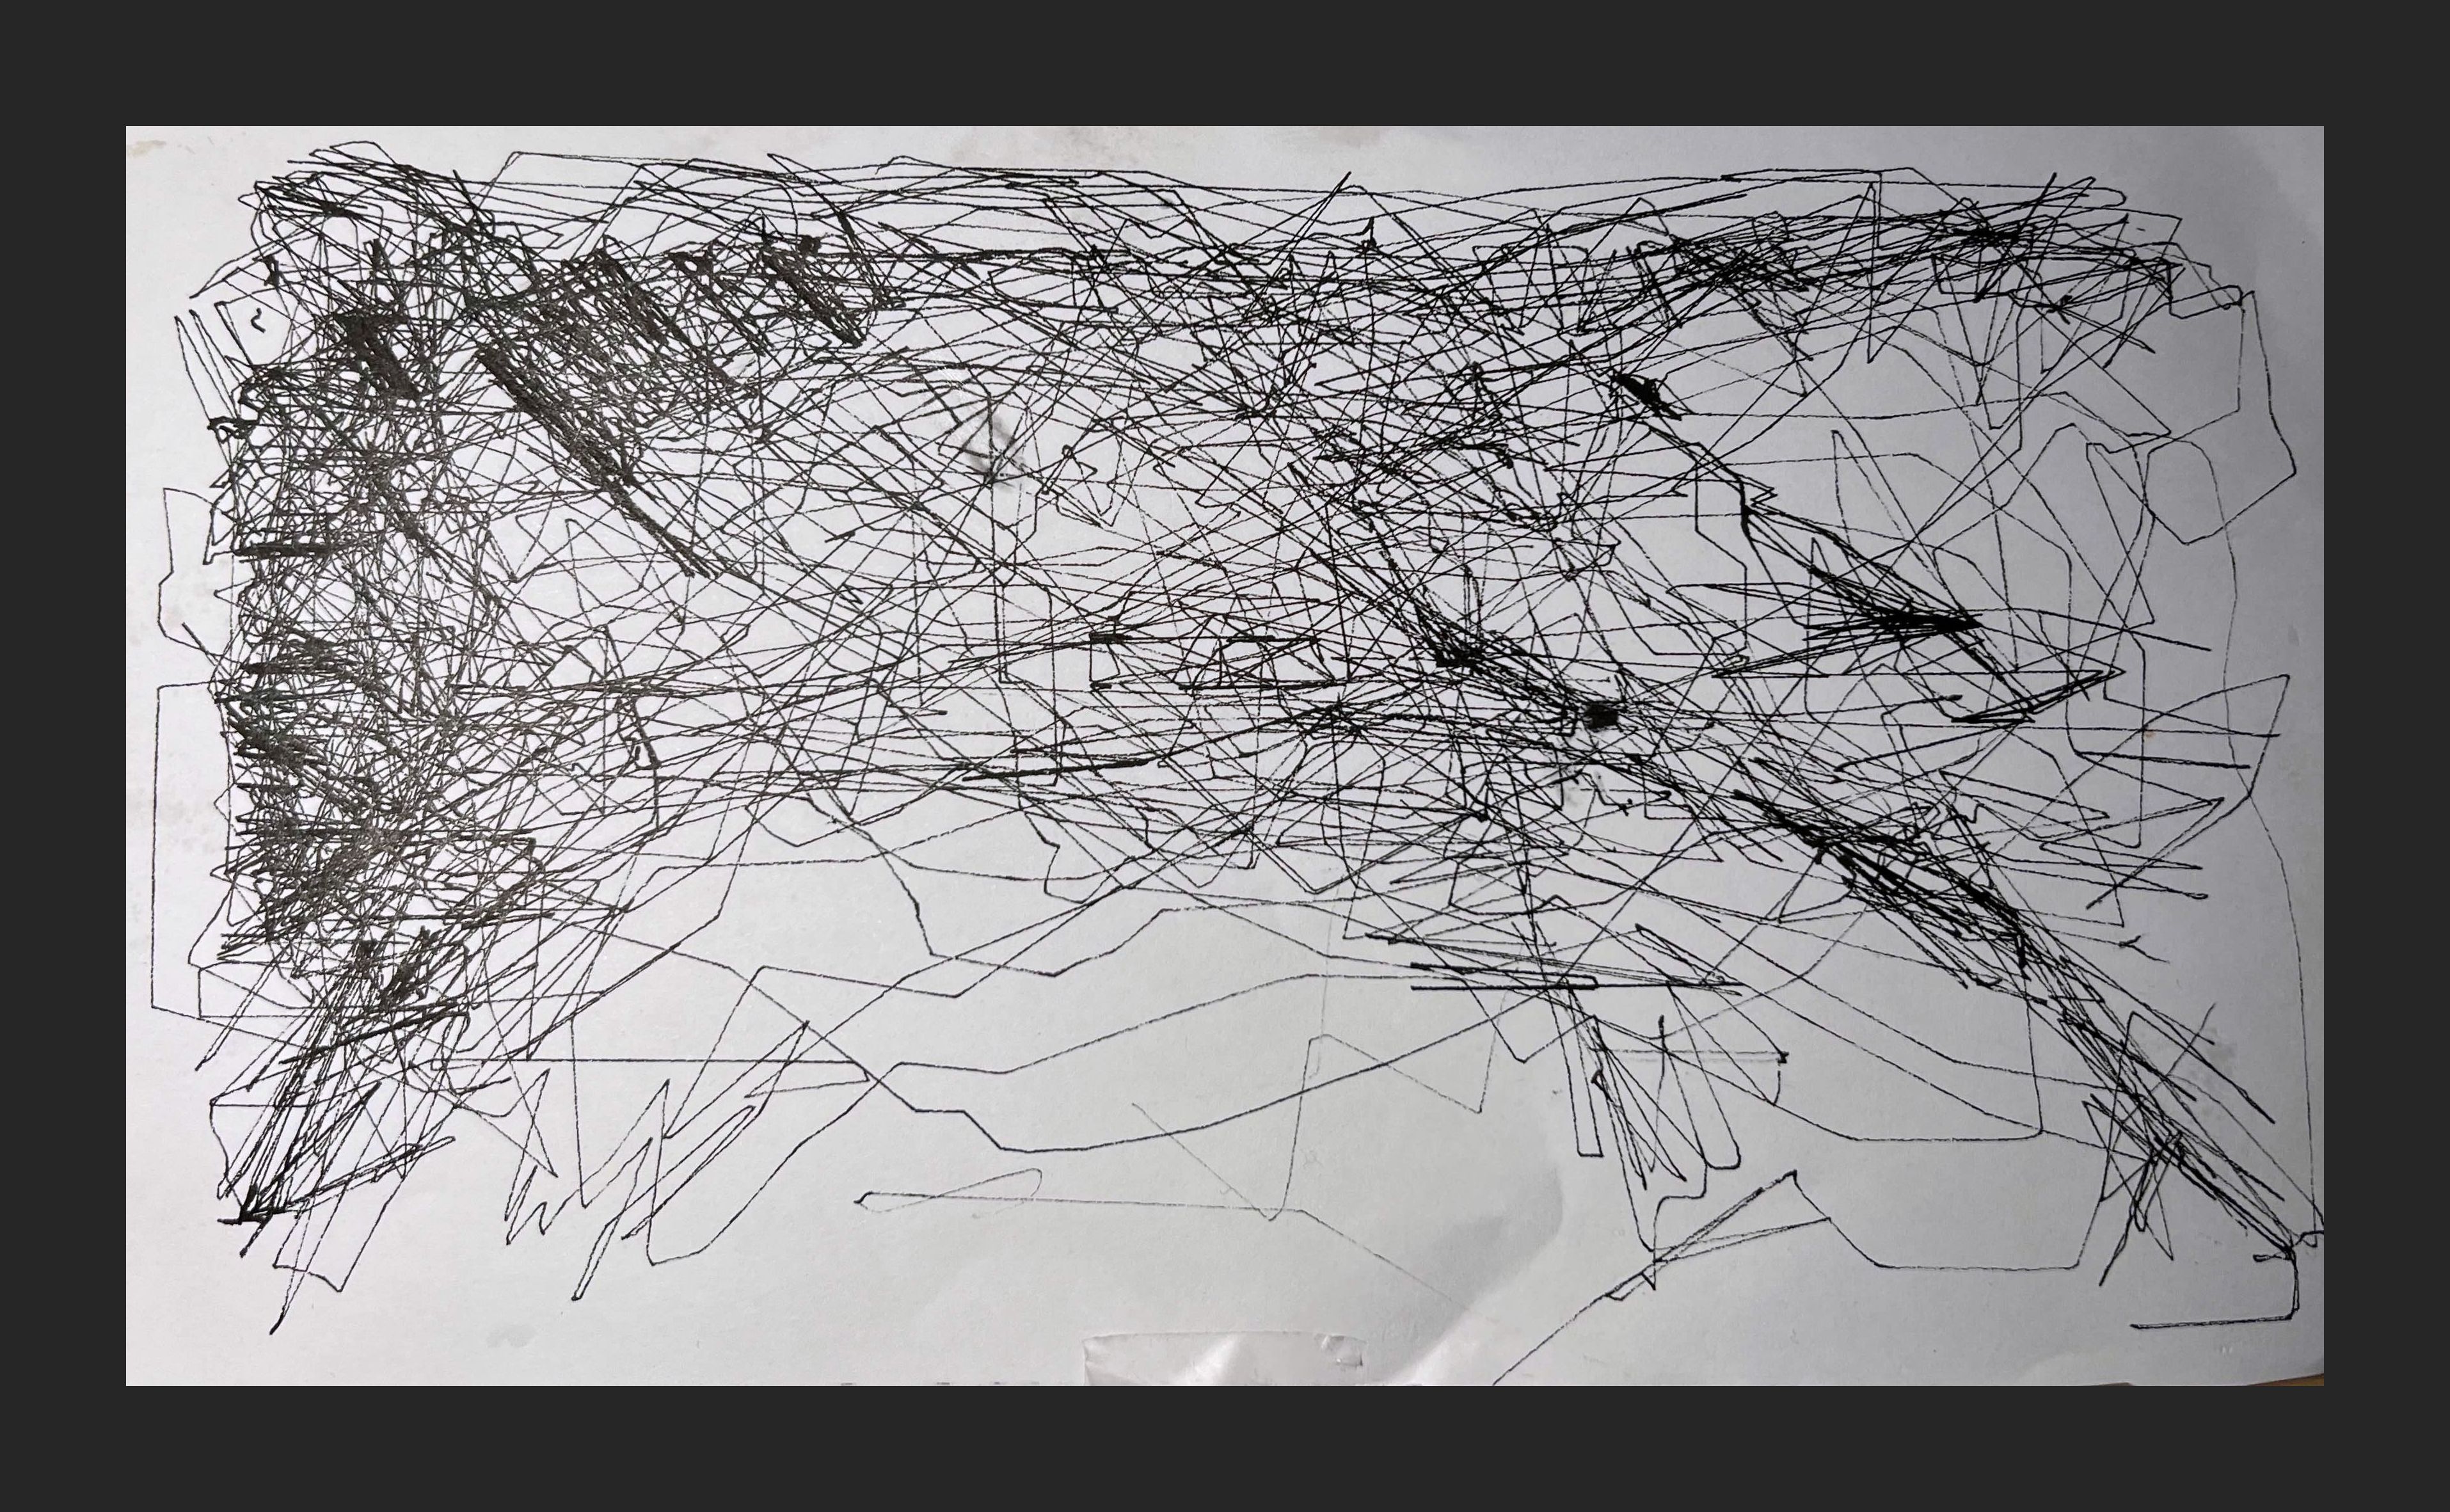
Ball and Line, 2024
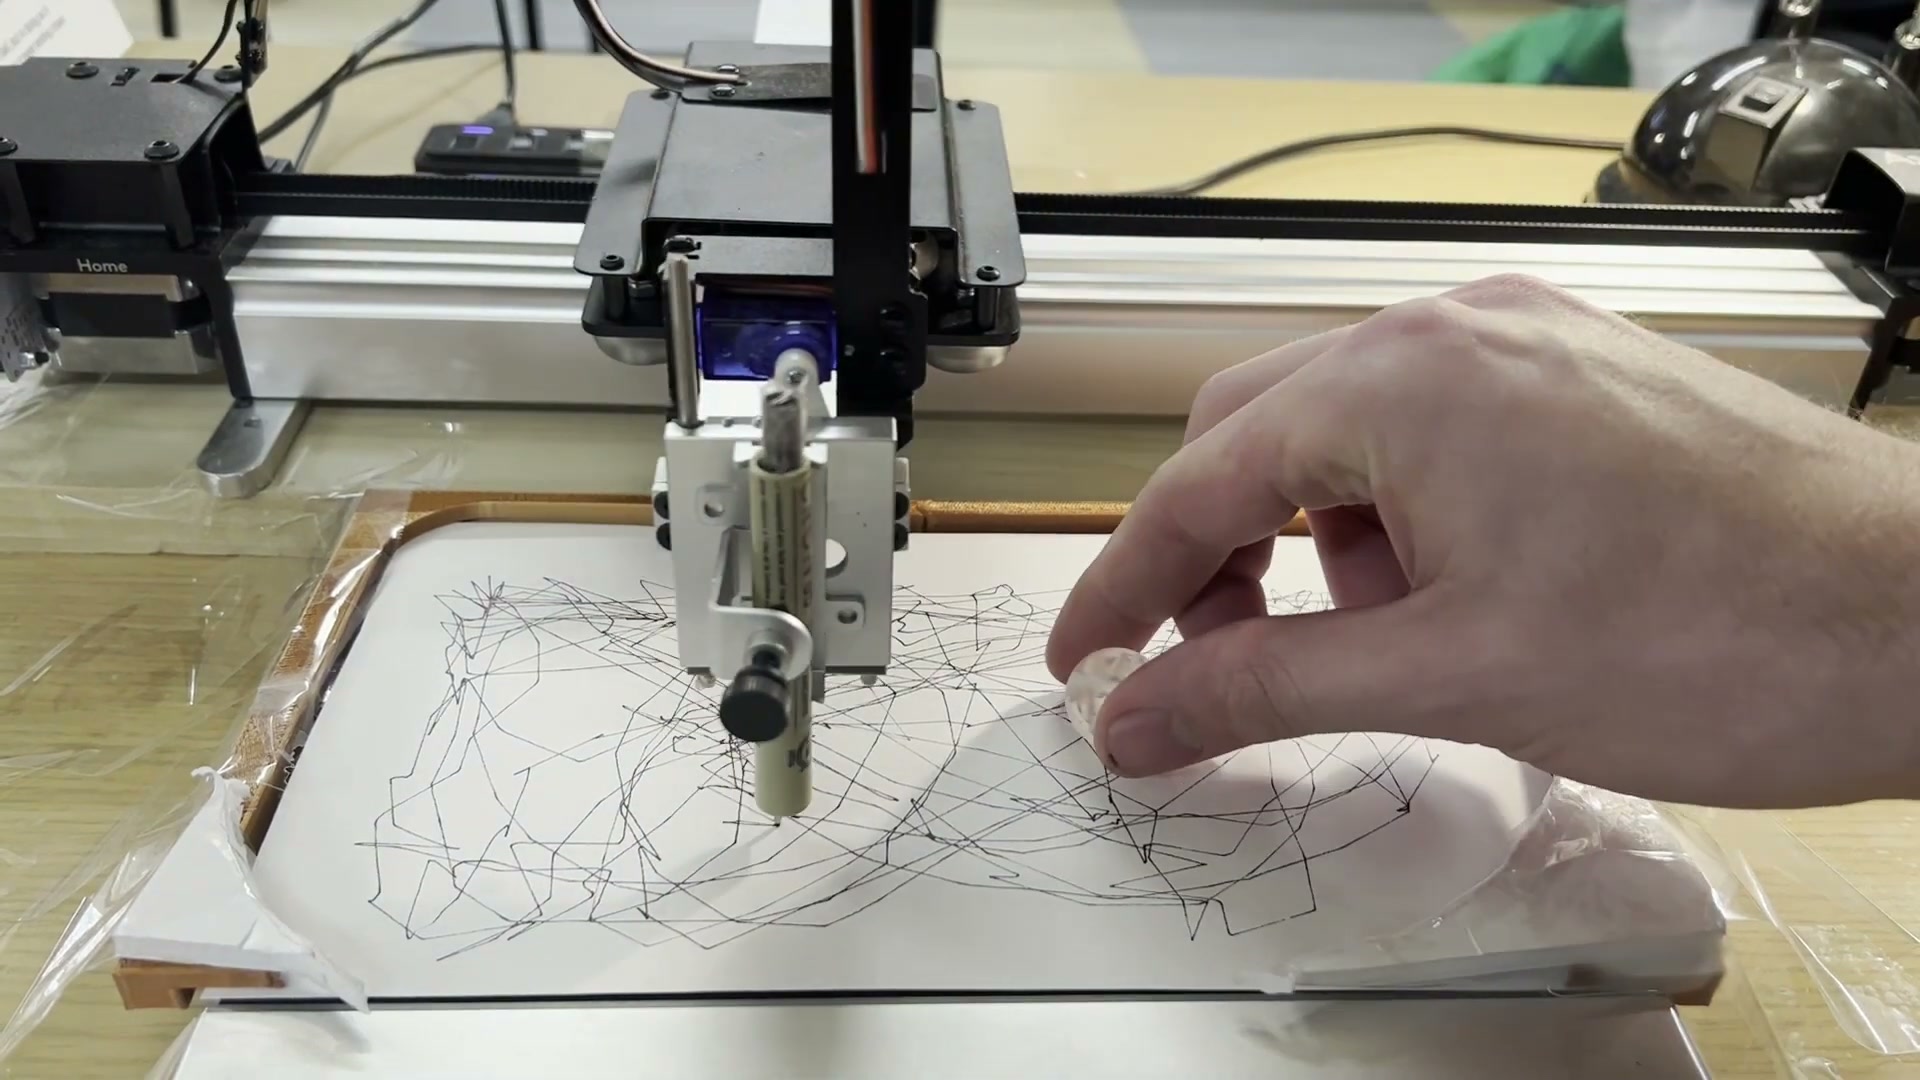
Axidraw, Sensel, Pen, Paper, Assorted Marbles
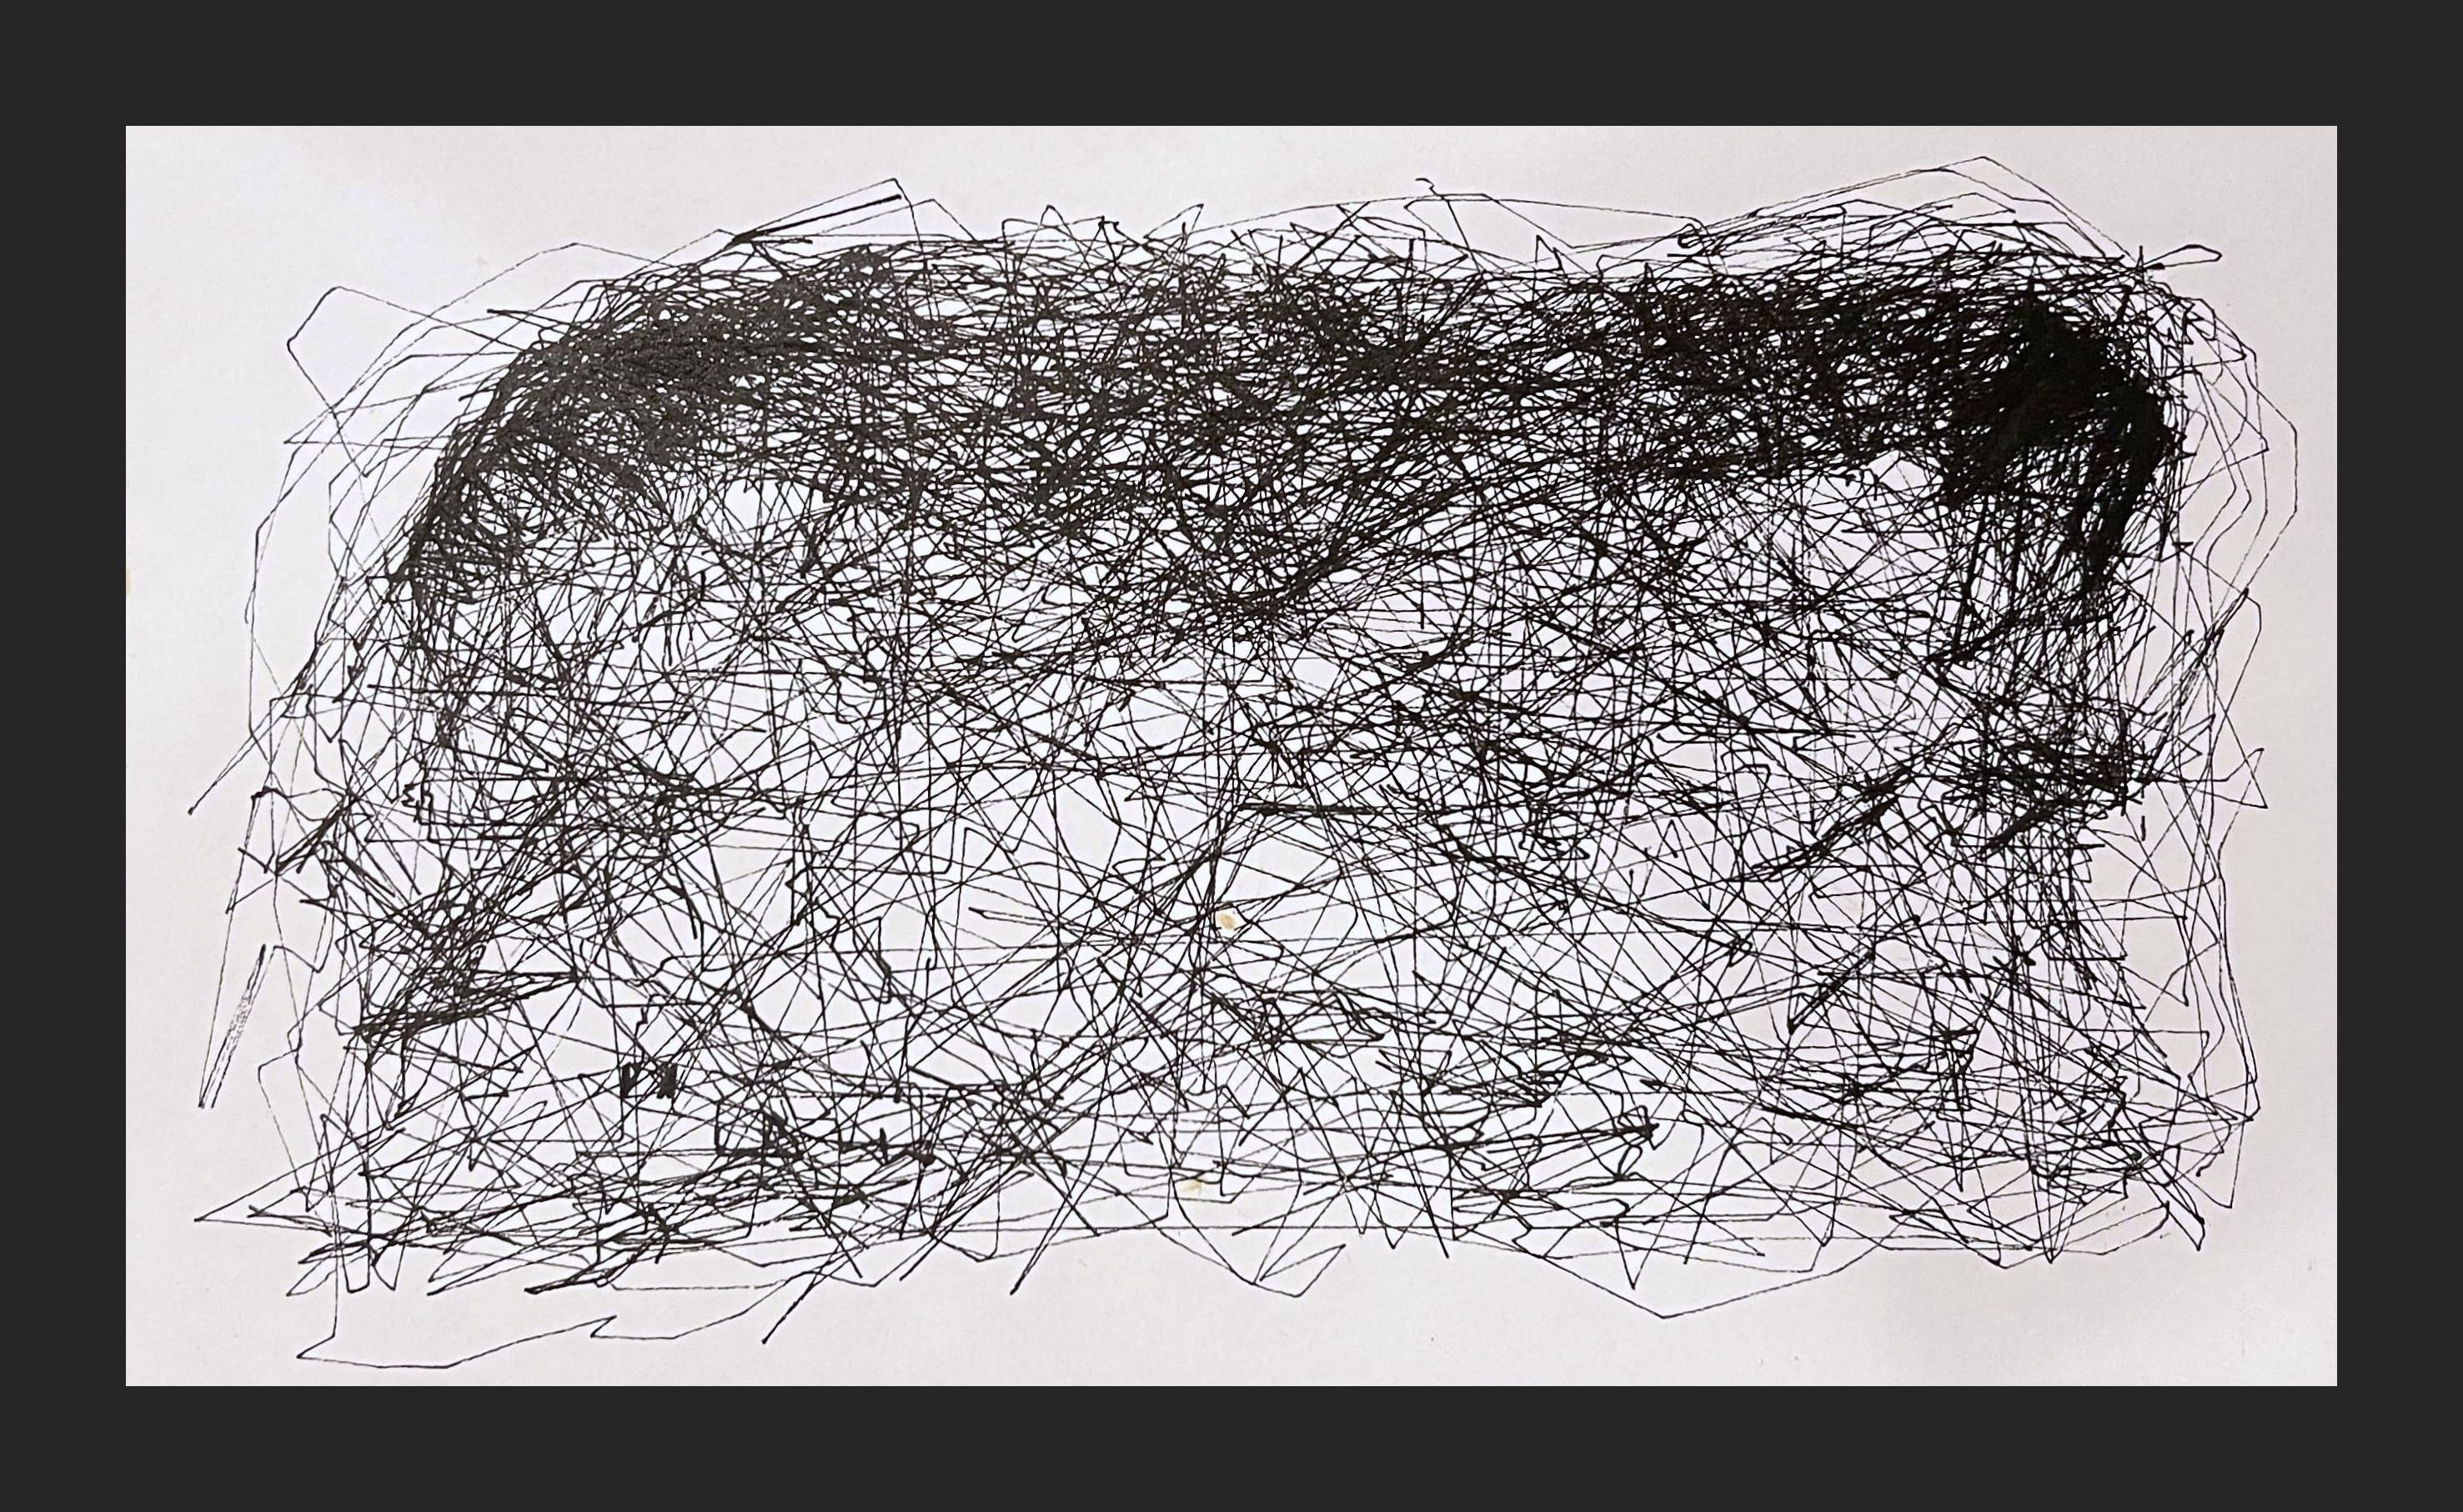
Collection of drawings created as a by-product of an endless chase across a paper
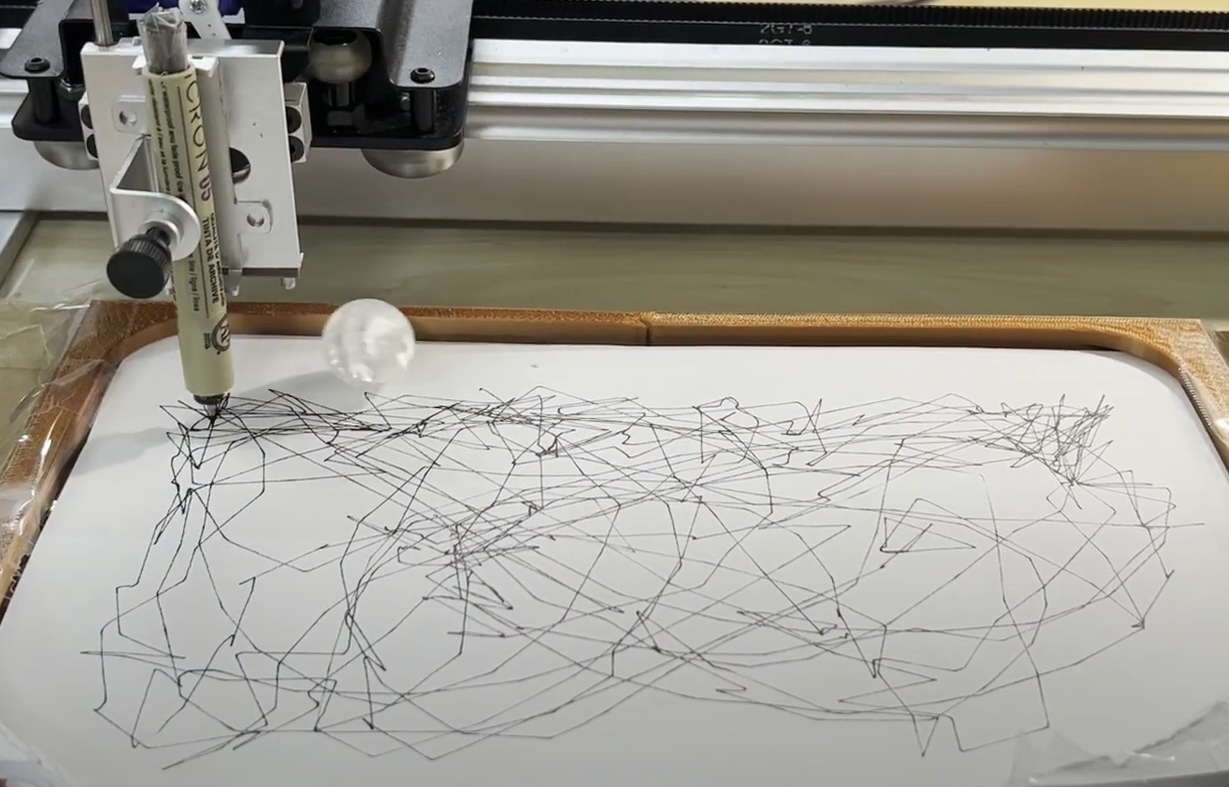
This piece is about a completely impossible task: move the pen to the ball. As the plotter tirelessly attempts to achieve its singular goal, it inevitably knocks the ball to a new position, beginning the chase all over again. Through the plotter’s eternal attempts to achieve this singular task, it unconsciously authors a far more complex drawing that stands as a scribbled testament to its eternal sisyphean struggle. The location of the marble is detected by a touchpad placed below the paper, which then directs the plotter to move to the sensed location of the marble.
Starting from the Sensor
November 2024
This project came out of Golan Levin’s Experimental Capture (“Excap”) class at Carnegie Mellon, a course about finding unusual uses for sensors and other input devices. The starting point was therefore a piece of hardware rather than an idea, and the hardware was a Sensel Morph, now long out of production.
The Morph is a flat pad whose entire surface is a matrix of individual pressure sensors. It does not report a single point of contact the way a button does; it reports a whole force map, giving for every cell in the grid a measure of how hard that cell is currently being pressed. The pressure readings from this grid are the basis for everything in this project.
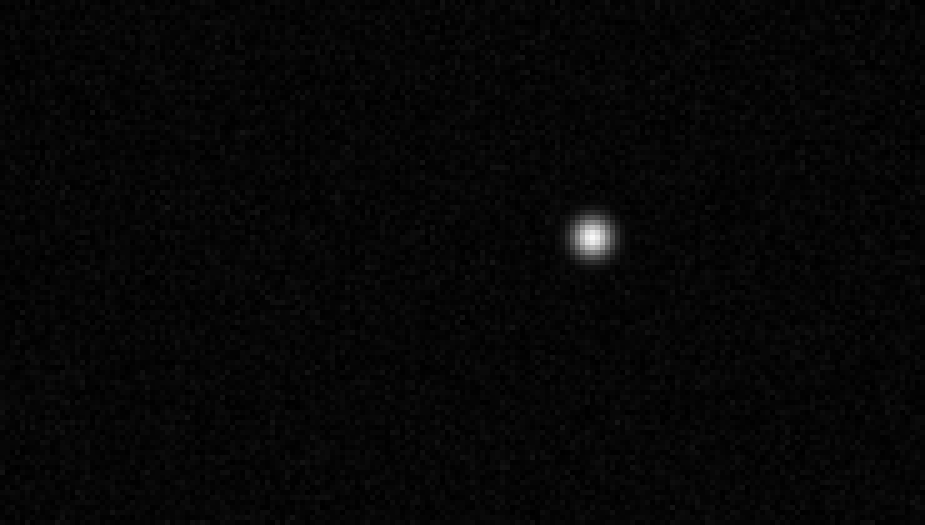
The force map, as the program displays it while running - brightness is pressure, and the bright point is a ball sitting on the pad. Reconstructed from the original display code; the pad itself was returned to the Excap tech cabinet.
Two things carry through both versions of the project. The code began as Sensel’s own MIT-licensed sensel_forceMap.py demo - the device handling and the live force-map window above are theirs, and everything that drives the plotter is built on top of that starting point. And the AxiDraw is driven live over a serial connection rather than by plotting a prepared file. There is no SVG anywhere in this project: everything is live calculated using data from the sensel.
The Crumple Plotter
November 13 - December 3, 2024
The original idea was very different from what the project became.
The plan was originally to create an in-place visualization of the crumpling of a sheet of paper: a drawing of a page’s creases, made on that same page. It would work like this:
1.Place the Sensel pad in the working area of the AxiDraw.
2.Crumple a sheet of paper, flatten it back out so it is covered in creases, and lay it on top of the pad.
3.Have the AxiDraw draw horizontal lines across the sheet, the pen pressing through the paper onto the pad beneath.
4.The pad reports the maximum pressure detected by any single pressure sensor. That value feeds back to the AxiDraw, which moves the pen slightly further down the page when it reads more pressure and slightly further up when it reads less.
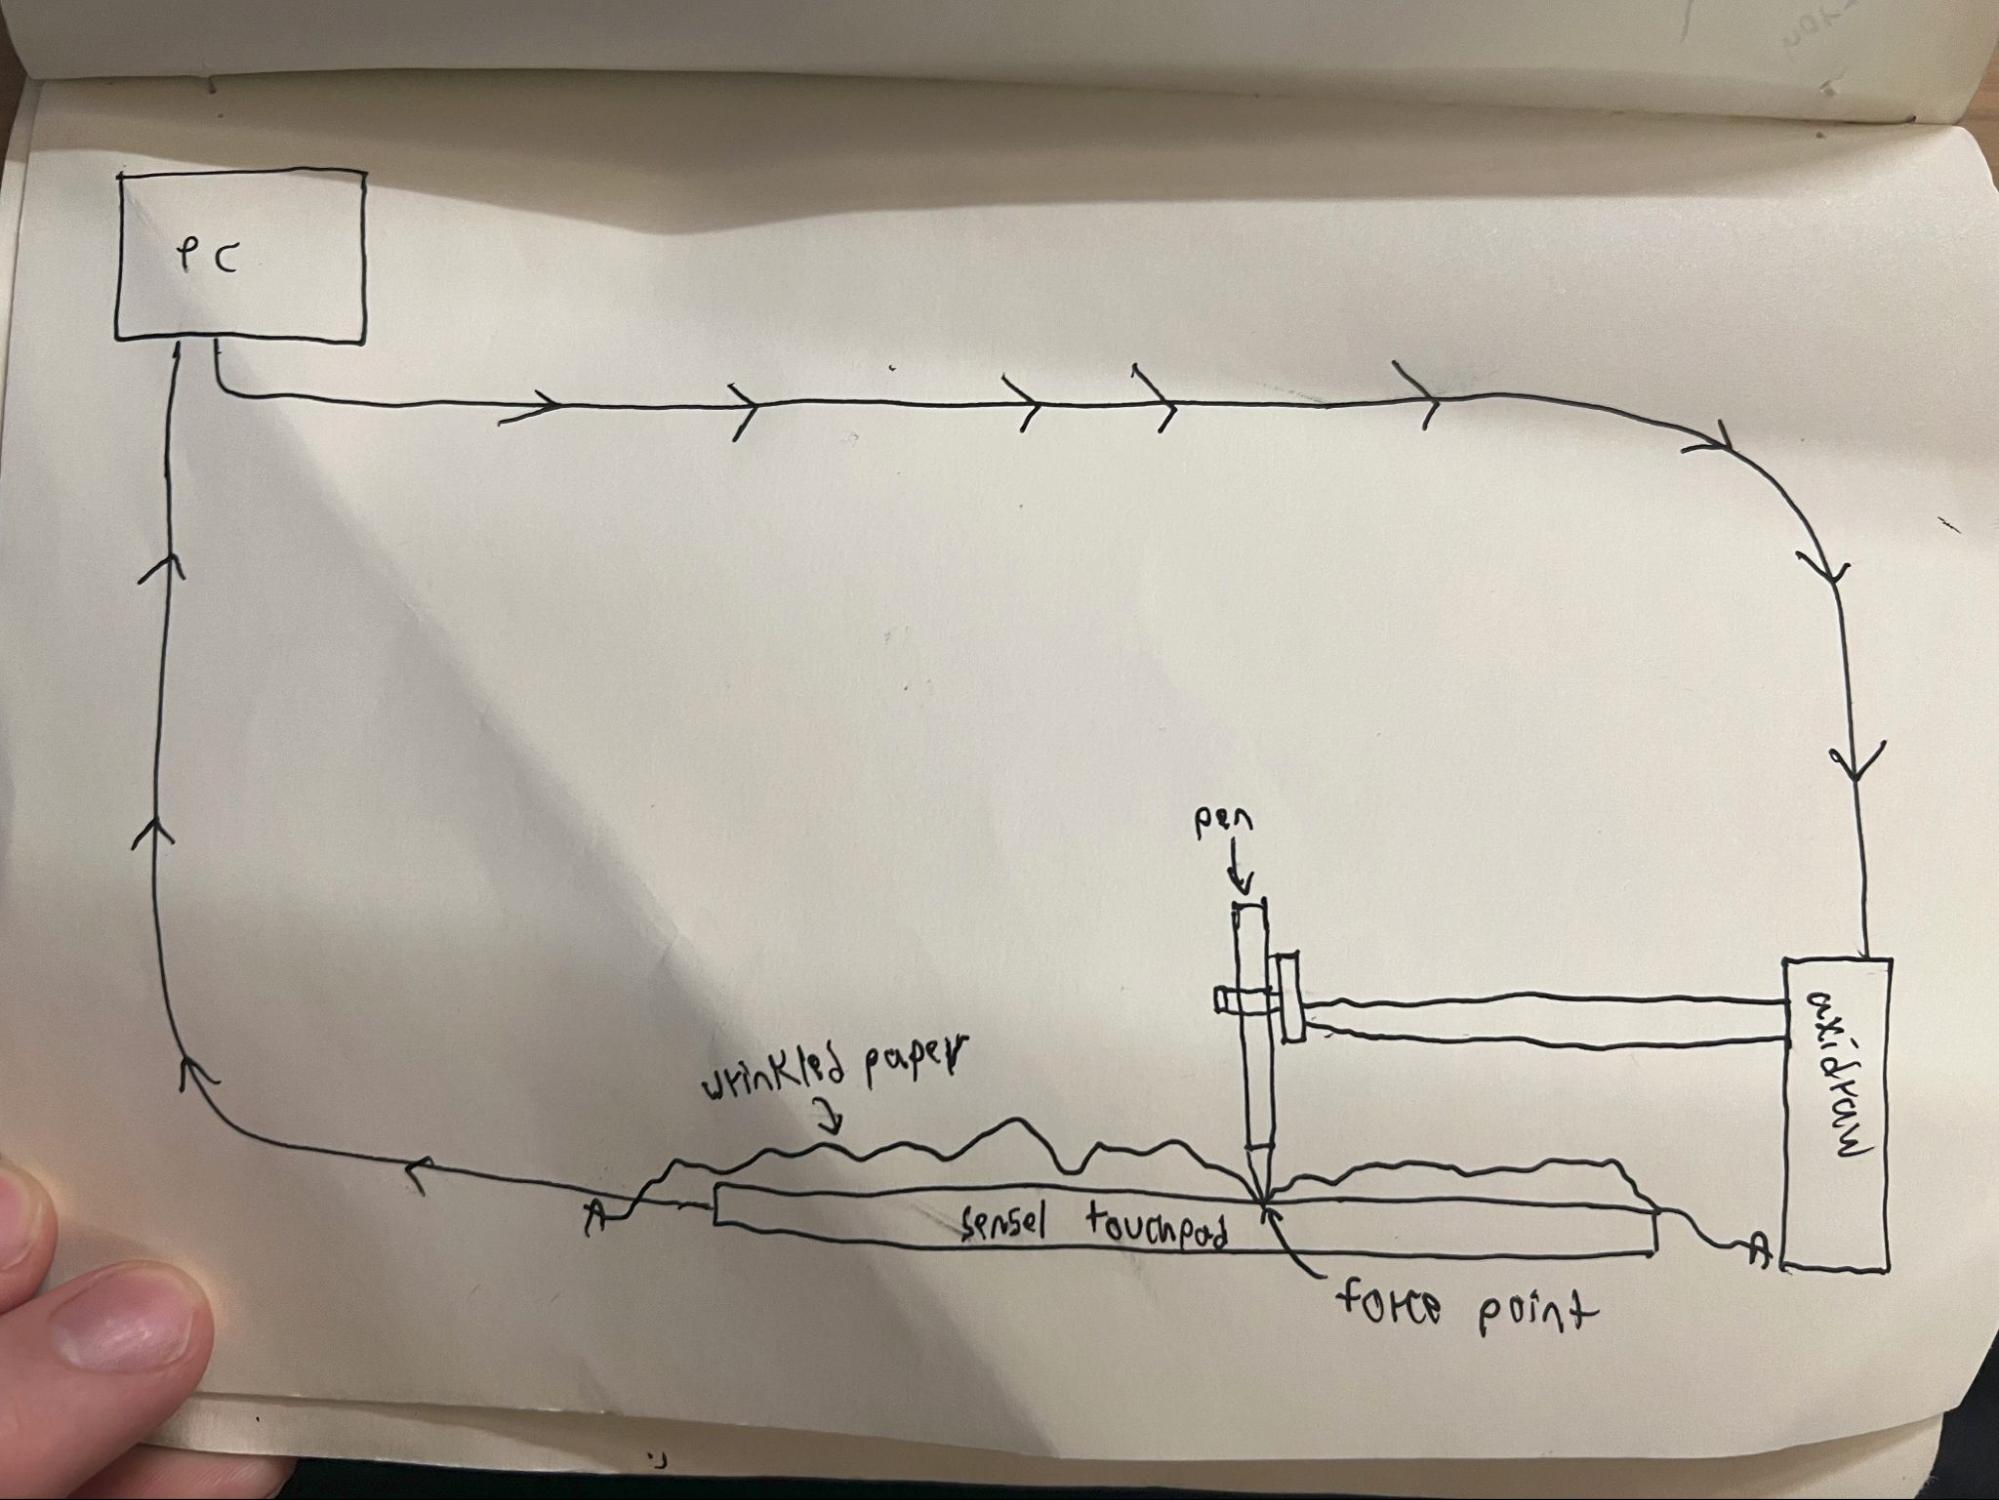
The system as I proposed it - an extremely rough diagram, but the loop is already there.
The theory
The pen’s weight never changes. What changes is how that weight lands on the pad.
Where the paper is pressed flush against the pad, the full weight of the nib is concentrated onto a single cell in the matrix, which reads high. Those are the topographically low points of the crumple. Where the nib rests on a “tent” - a topographically high point, where the paper is lifted off the pad and not touching it - the same weight is distributed across a much larger area, and the maximum pressure reading detected by any single pressure sensor in the grid drops.
So the line rises on the page where the crumple is topographically high, and falls where it is topographically low. Stack enough of those lines on top of one another and you have a drawing of the sheet’s topography, drawn on the sheet itself.
Results
I really had no idea whether the theory would hold up in practice. The first tests looked promising.
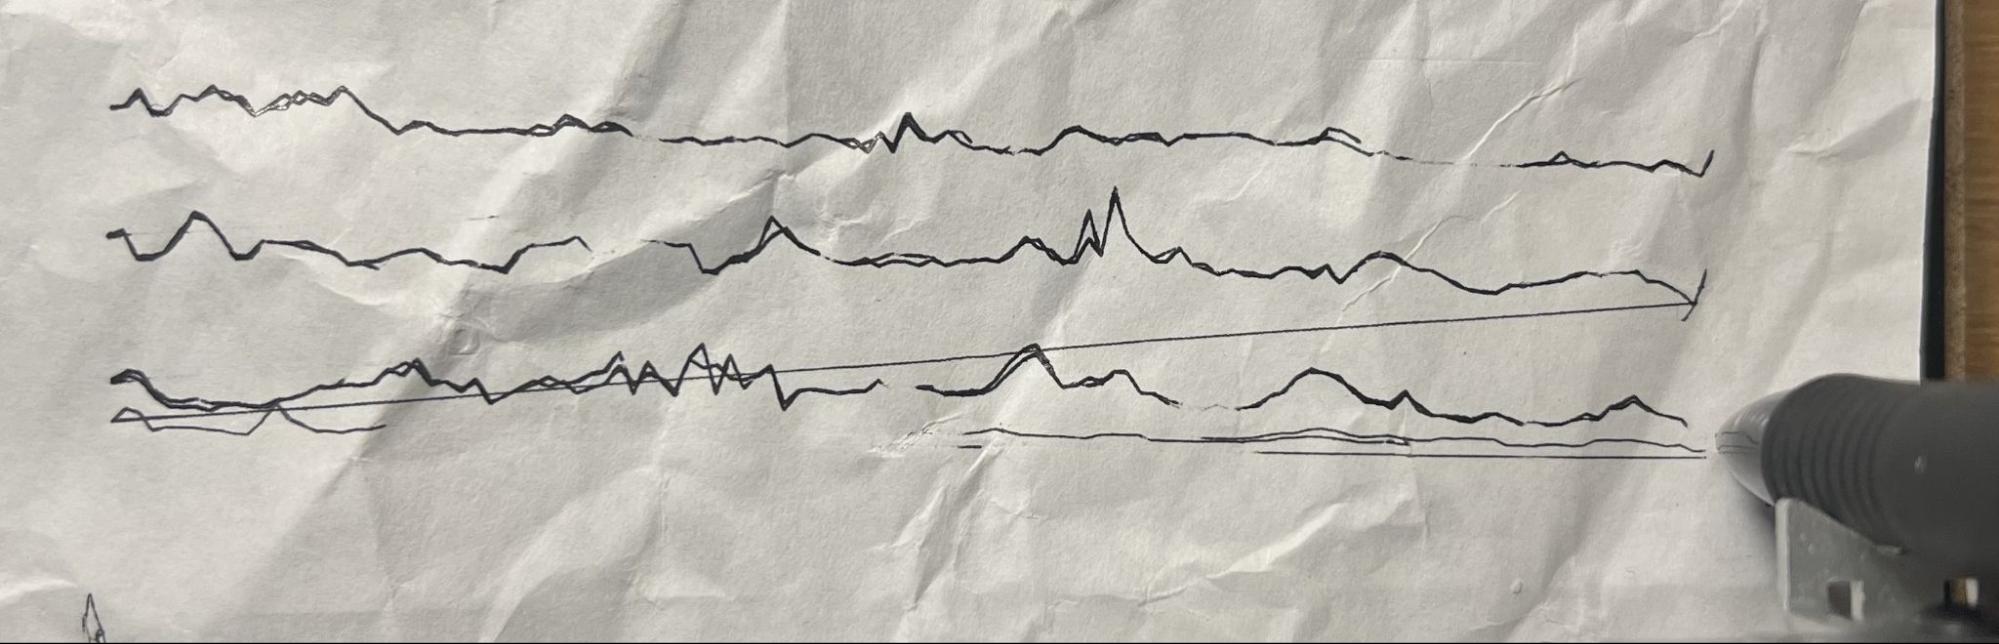
Three lines on a crumpled sheet.
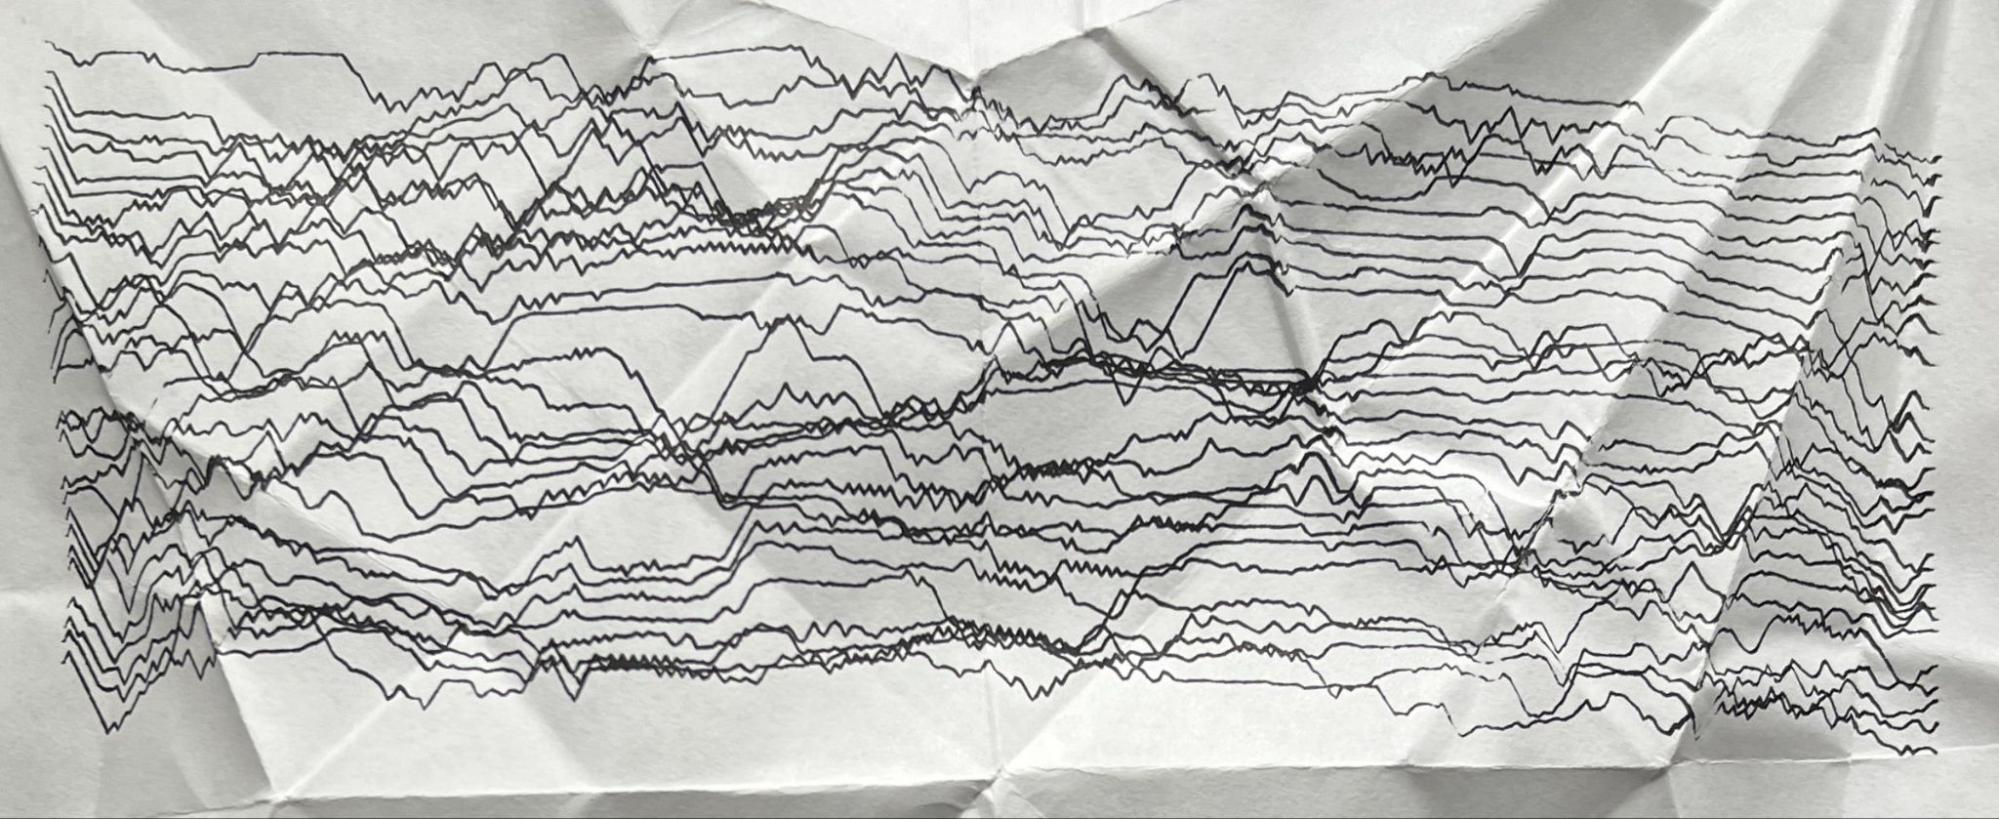
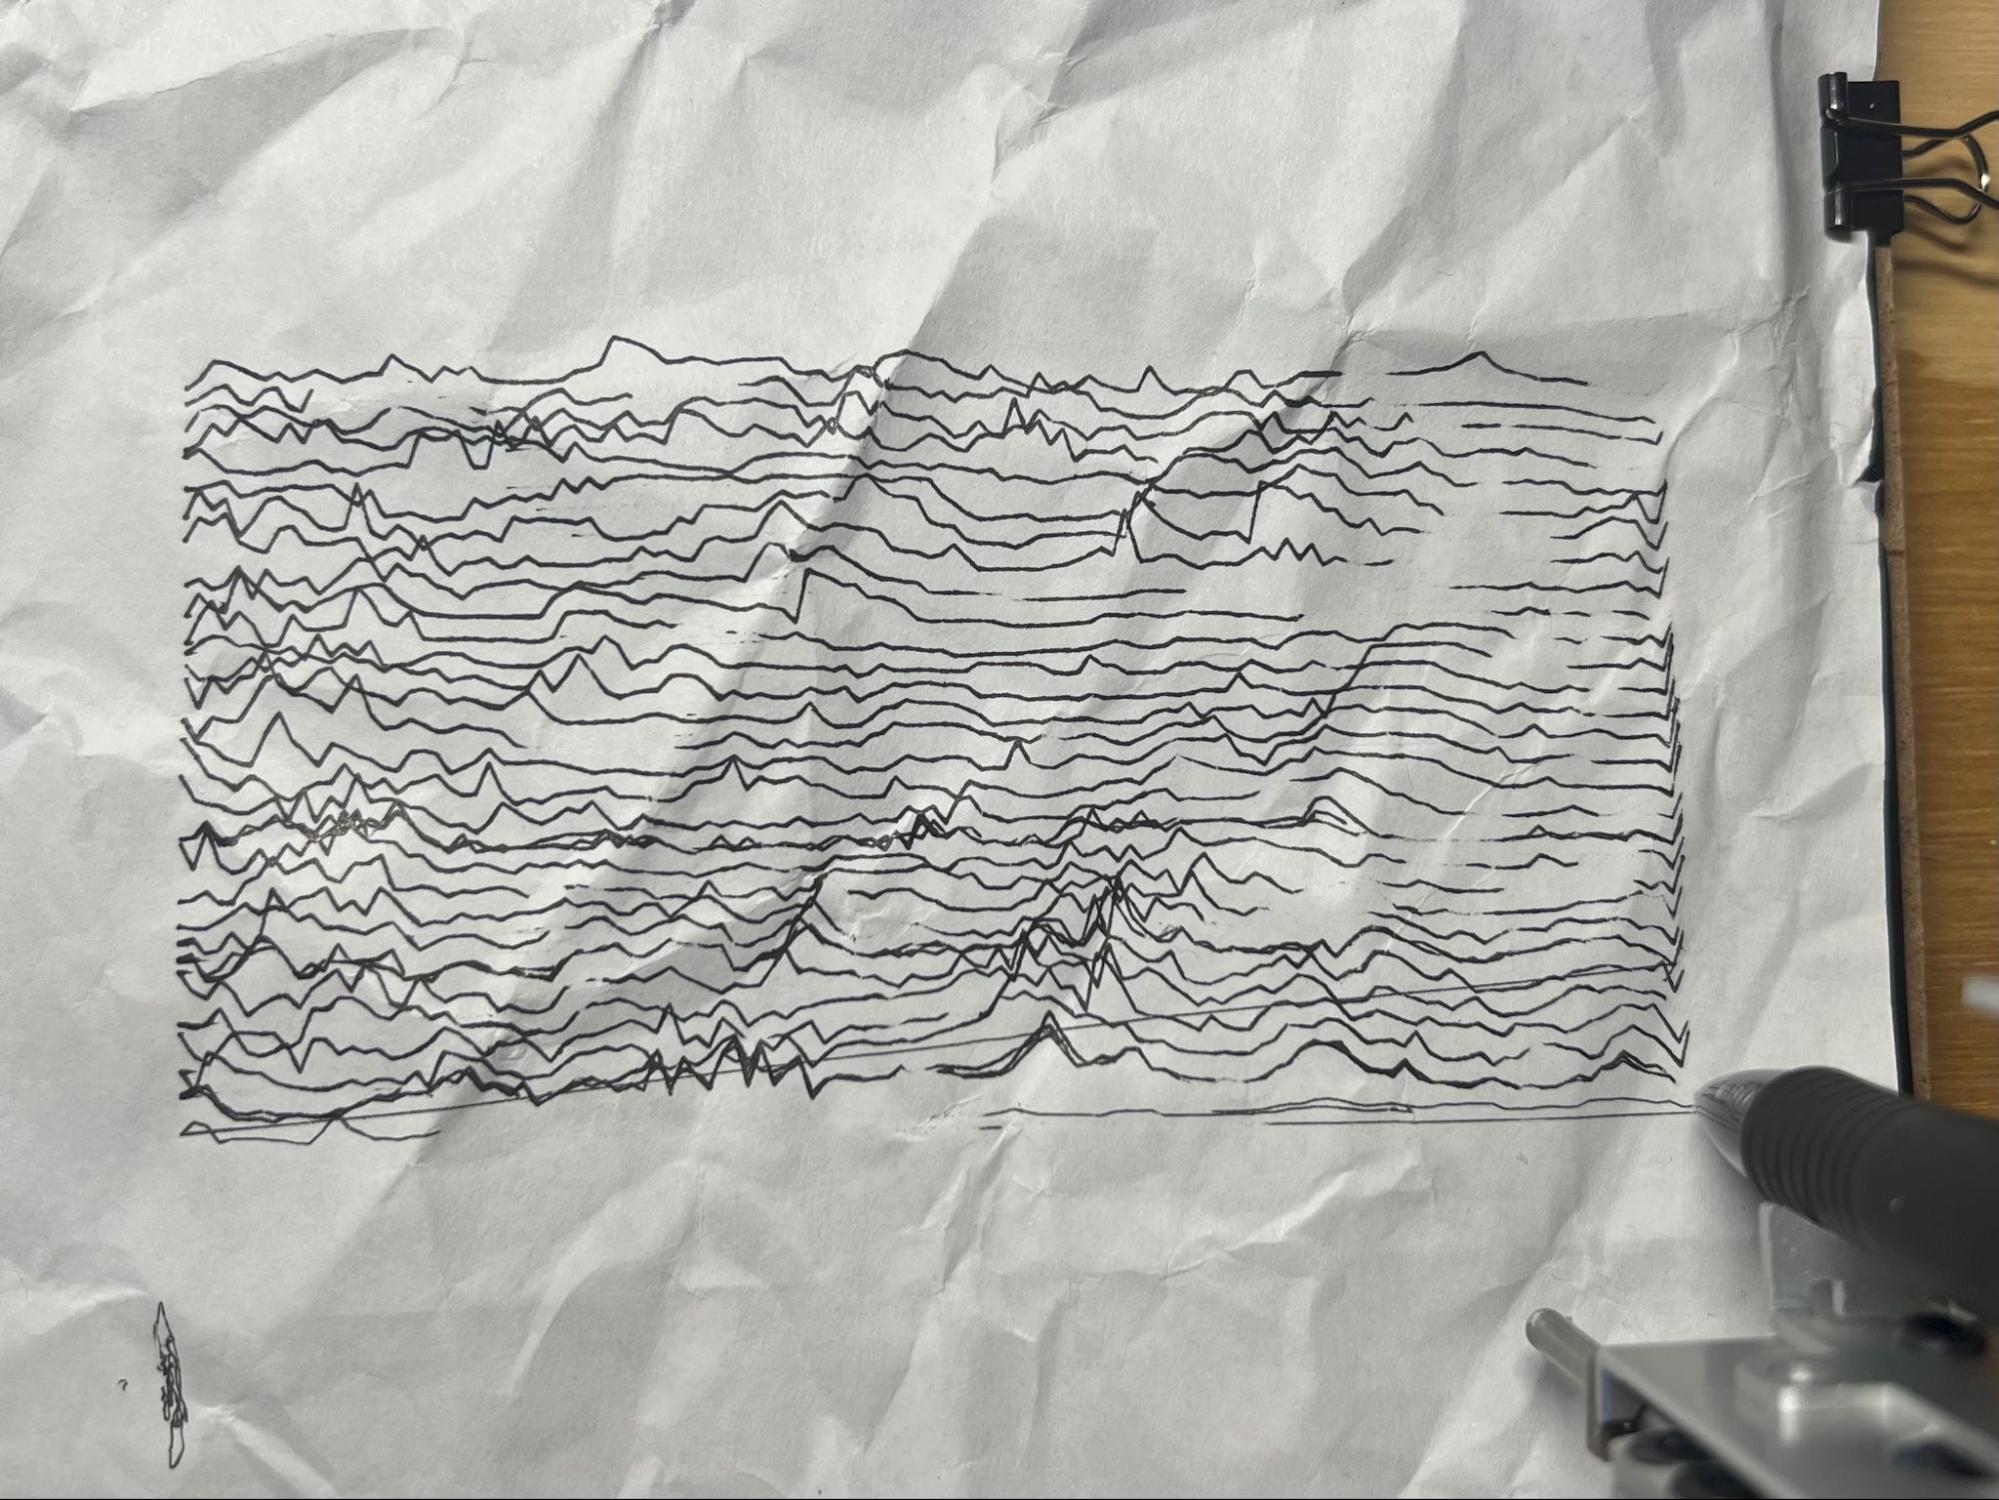
Full fields of lines across a crumpled sheet.
My main concern going in was that I would not be measuring anything at all - that the pad would not be sensitive enough to these differences and the height of the lines would simply be random. That did not appear to be the case. Across vertically adjacent lines there were consistent regions of higher and lower deflection. If each line were random, neighboring lines would not agree with one another about where the highs and lows are.
But these line fields also hinted at the thing that ultimately doomed this version of the project: the high and low areas of the drawing do not visibly correspond to the crumples actually on the page.
The test that proved it was measuring the wrong thing
I was still worried the lines might be random after all, so to settle it I ran the plotter over the exact same line on the paper twice. If the system were measuring nothing, the two runs would come out completely different. If it were measuring something real about where the pen is, both runs would show the same pattern of highs and lows.
Two tests, two runs each. Both times, the two runs traced very nearly the same highs and lows.
The test proved that the system was measuring something real about the position of the pen. It also made the results considerably stranger.
The first test ran on a perfectly flat sheet of paper, where there should have been almost no variation in pressure at all - and it still produced a varied line, one that would suggest a crumpled sheet. The second ran on a sheet so heavily crumpled that the pen was frequently nowhere near a point where the paper touched the pad, so the nib’s weight should have been distributed away to almost nothing. However, the topographically high points in the paper seemed just as likely to push the line up as to push it down. And yet the repeat runs reproduced the same inexplicable result, so this was not simply randomness.
What it was actually measuring
The answer is that I was measuring the pad’s own variation in sensitivity.
The individual cells in the matrix do not all respond identically to the same force - each one is slightly more or slightly less sensitive than its neighbors. Crucially, that variation is fixed in place. Cell (x, y) always reads a little high or a little low, which makes it behave exactly like a real signal tied to position. Run the pen along the same path twice and you get the same trace both times, because you are re-reading the same cells in the same order. That is why the repeat test came out consistent.
The problem is one of scale. The difference I was trying to detect - a nib’s weight concentrated on one cell versus spread across several - is small, and it lives within a narrow band of force. The cell-to-cell variation in sensitivity was large enough to swamp it. The plotter was faithfully and repeatably recording something real, and that something was the pad, not the paper.
What survived
This is a limitation of the instrument, not a defect in it. The Morph is built to report where it is being pressed. Its design case is a surface you can lay any control layout over - a musical keyboard, or a custom typing layout for someone with limited finger mobility - which mostly needs to know whether a given region is being pressed or not. What I was asking for instead was a fine distinction between a concentrated and a distributed pen weight, inside a narrow force range. That is not what the sensor is for.
So I needed something that worked with the use case the Morph was designed for and was still worth making. I also still wanted the quality that drew me to the original idea: an in-place measurement, where a material is both the source of the phenomenon and the substrate that records it.
Ball and Line
December 3 - 13, 2024
The idea I arrived at keeps the in-place record, but makes the creation of this recording just as important as the finished record.
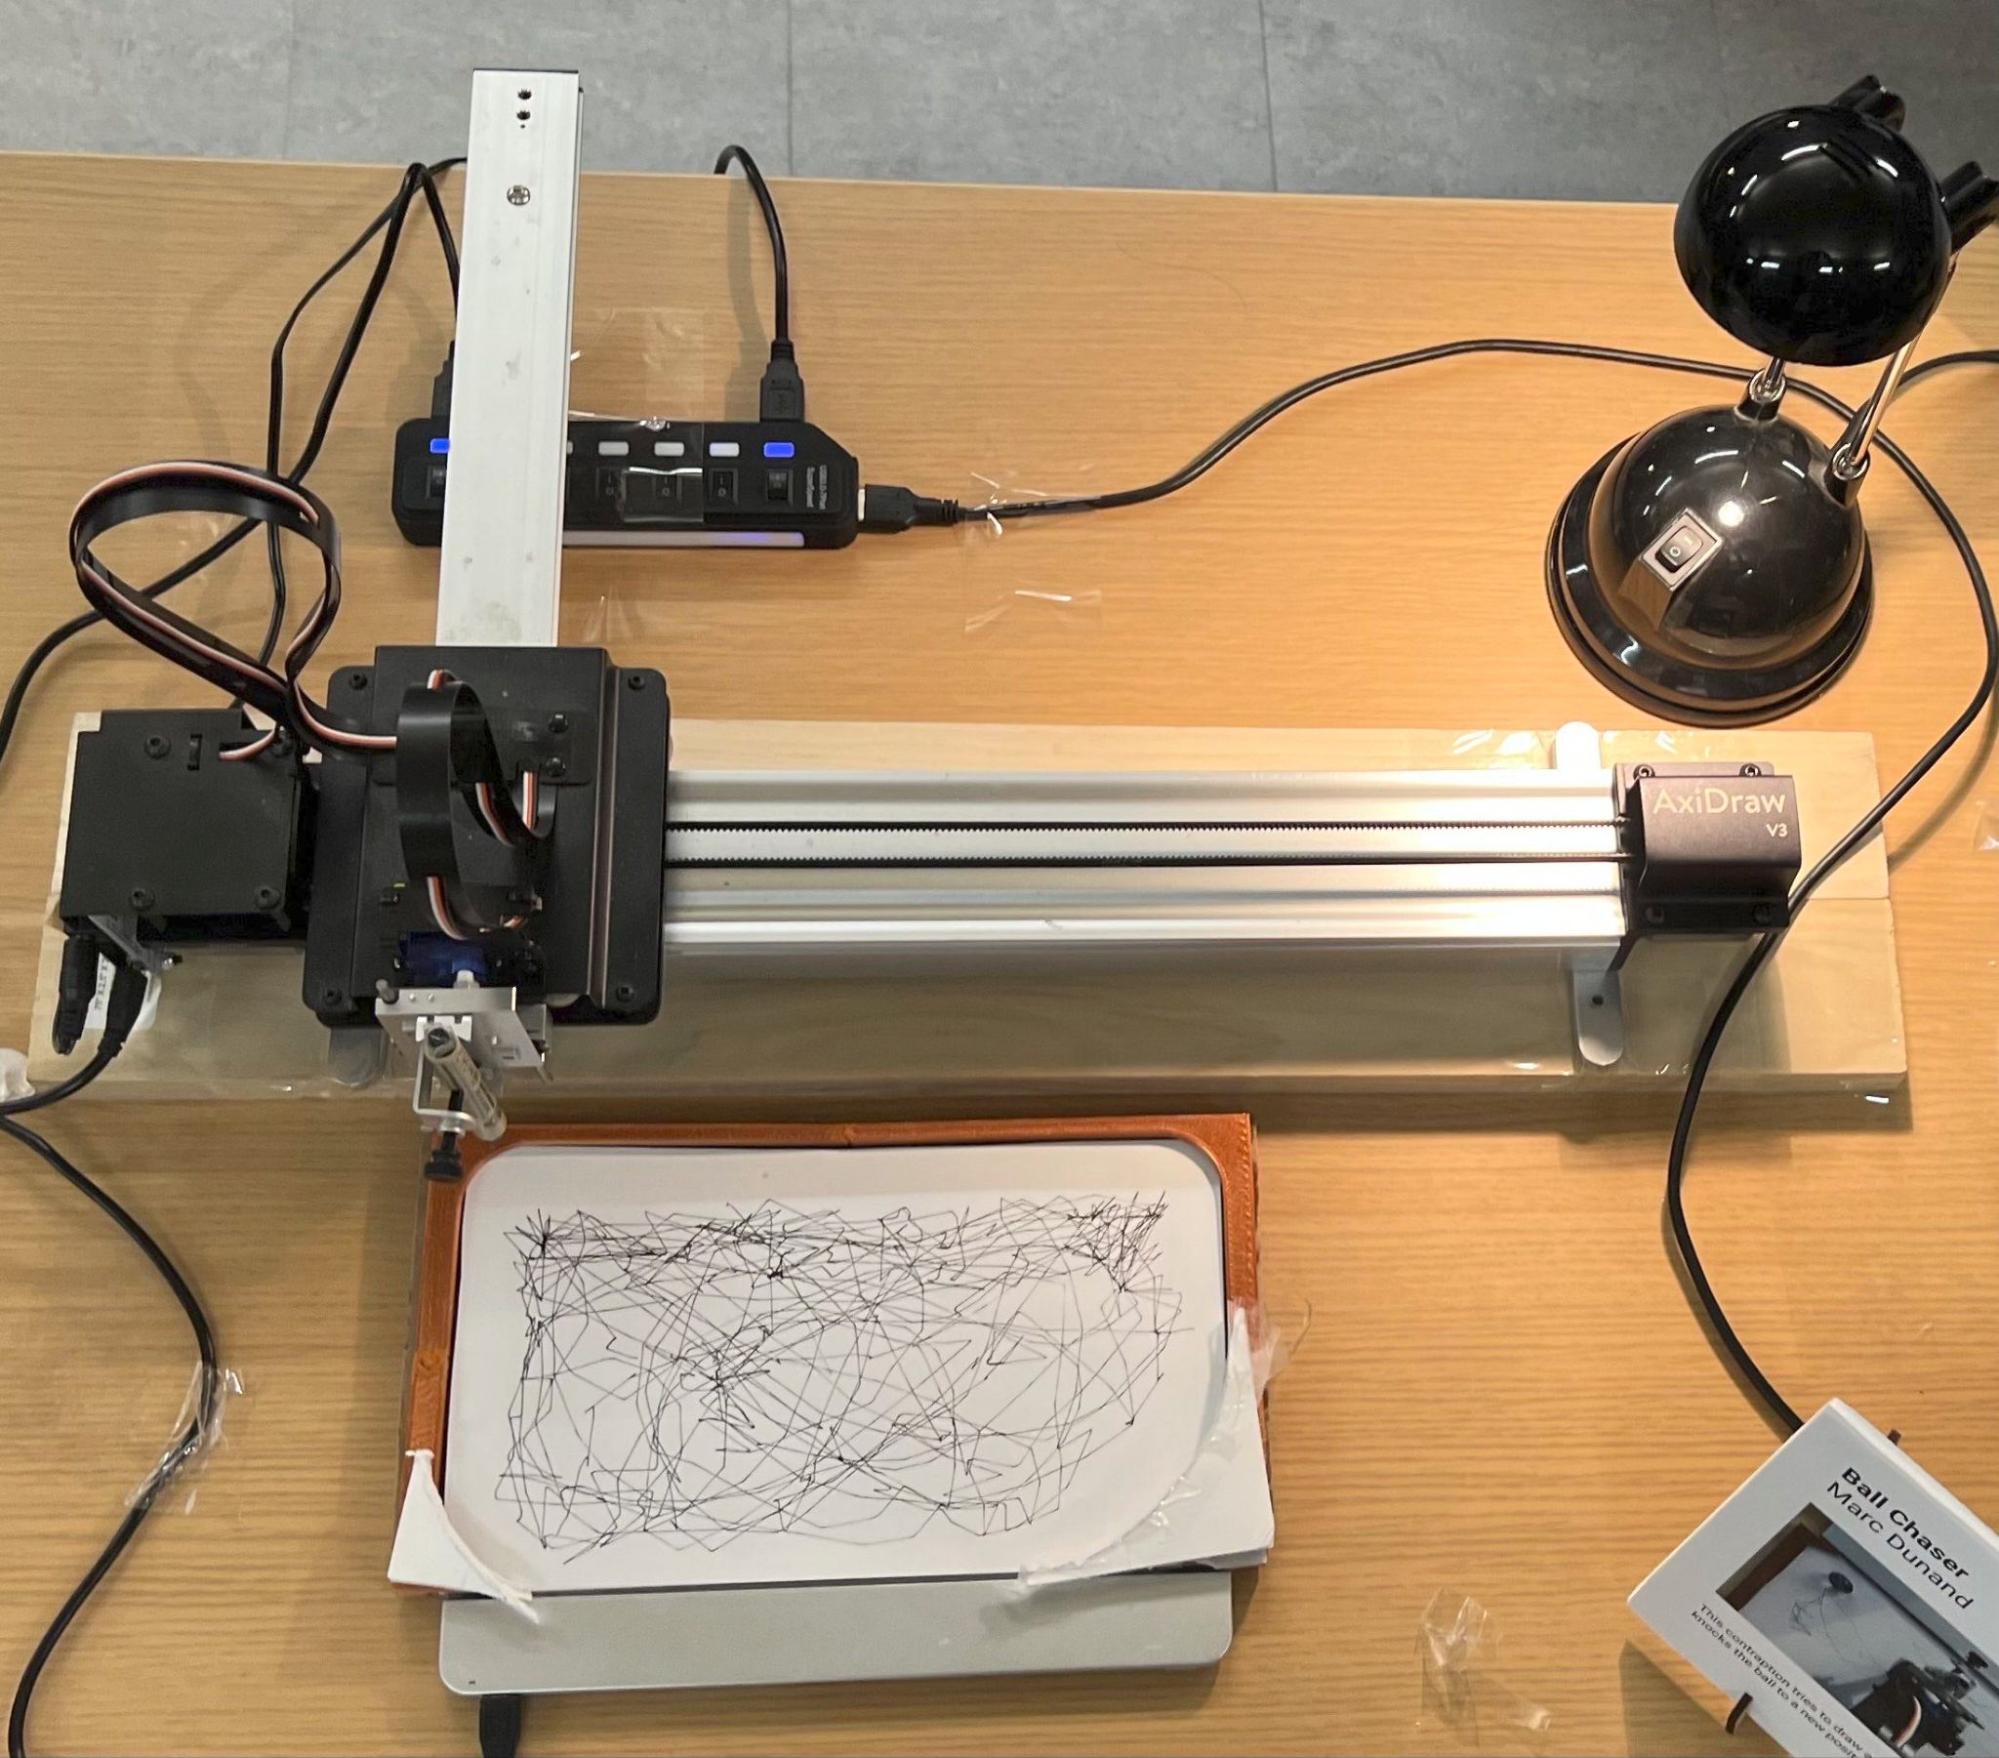
The setup is nearly the same as before: a sheet of paper on top of the Sensel pad, and an AxiDraw making marks on that sheet. There is one new component - a marble.
The clearest way to describe the change is in terms of the system’s input and output. The output is the same in both versions: a plot drawn by the pen. What changed is the input. In the crumple plotter, the input was the pen nib itself, and specifically how much pressure it produced. Now the input is the marble, and specifically where its pressure is. I no longer cared how hard the marble pressed, only where it pressed - and therefore where the marble was. Reporting the location of a single heavy ball is functionally identical to reporting the location of a finger press, which is precisely the Morph’s intended use case.
I did a very simple thing with the location of the marble. I just told the AxiDraw to move the pen to the marble.
But what happens when the pen reaches the marble? It knocks it out of the way. The marble’s location changes, and the AxiDraw sets off after it again. The whole time, the pen stays down, drawing a line - a record of everywhere the pen has gone in its chase, which is itself an approximation of the path of the marble.
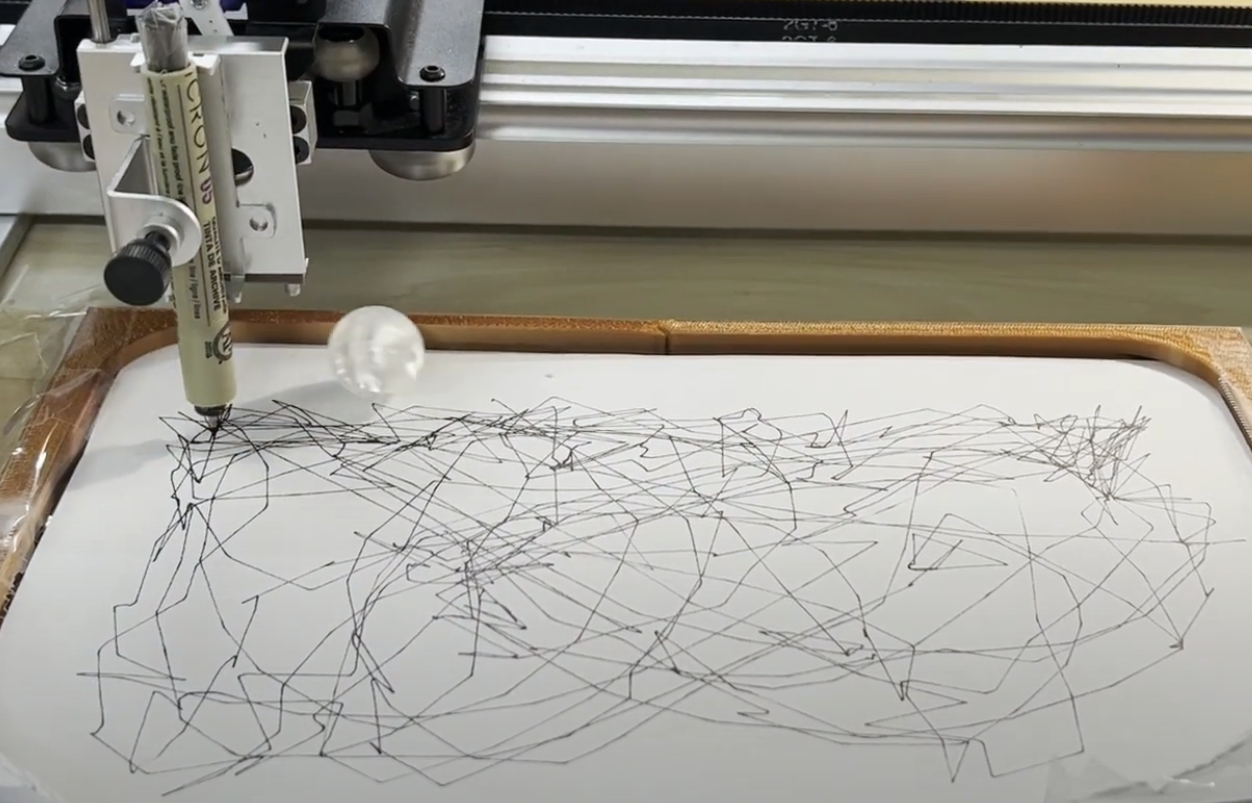
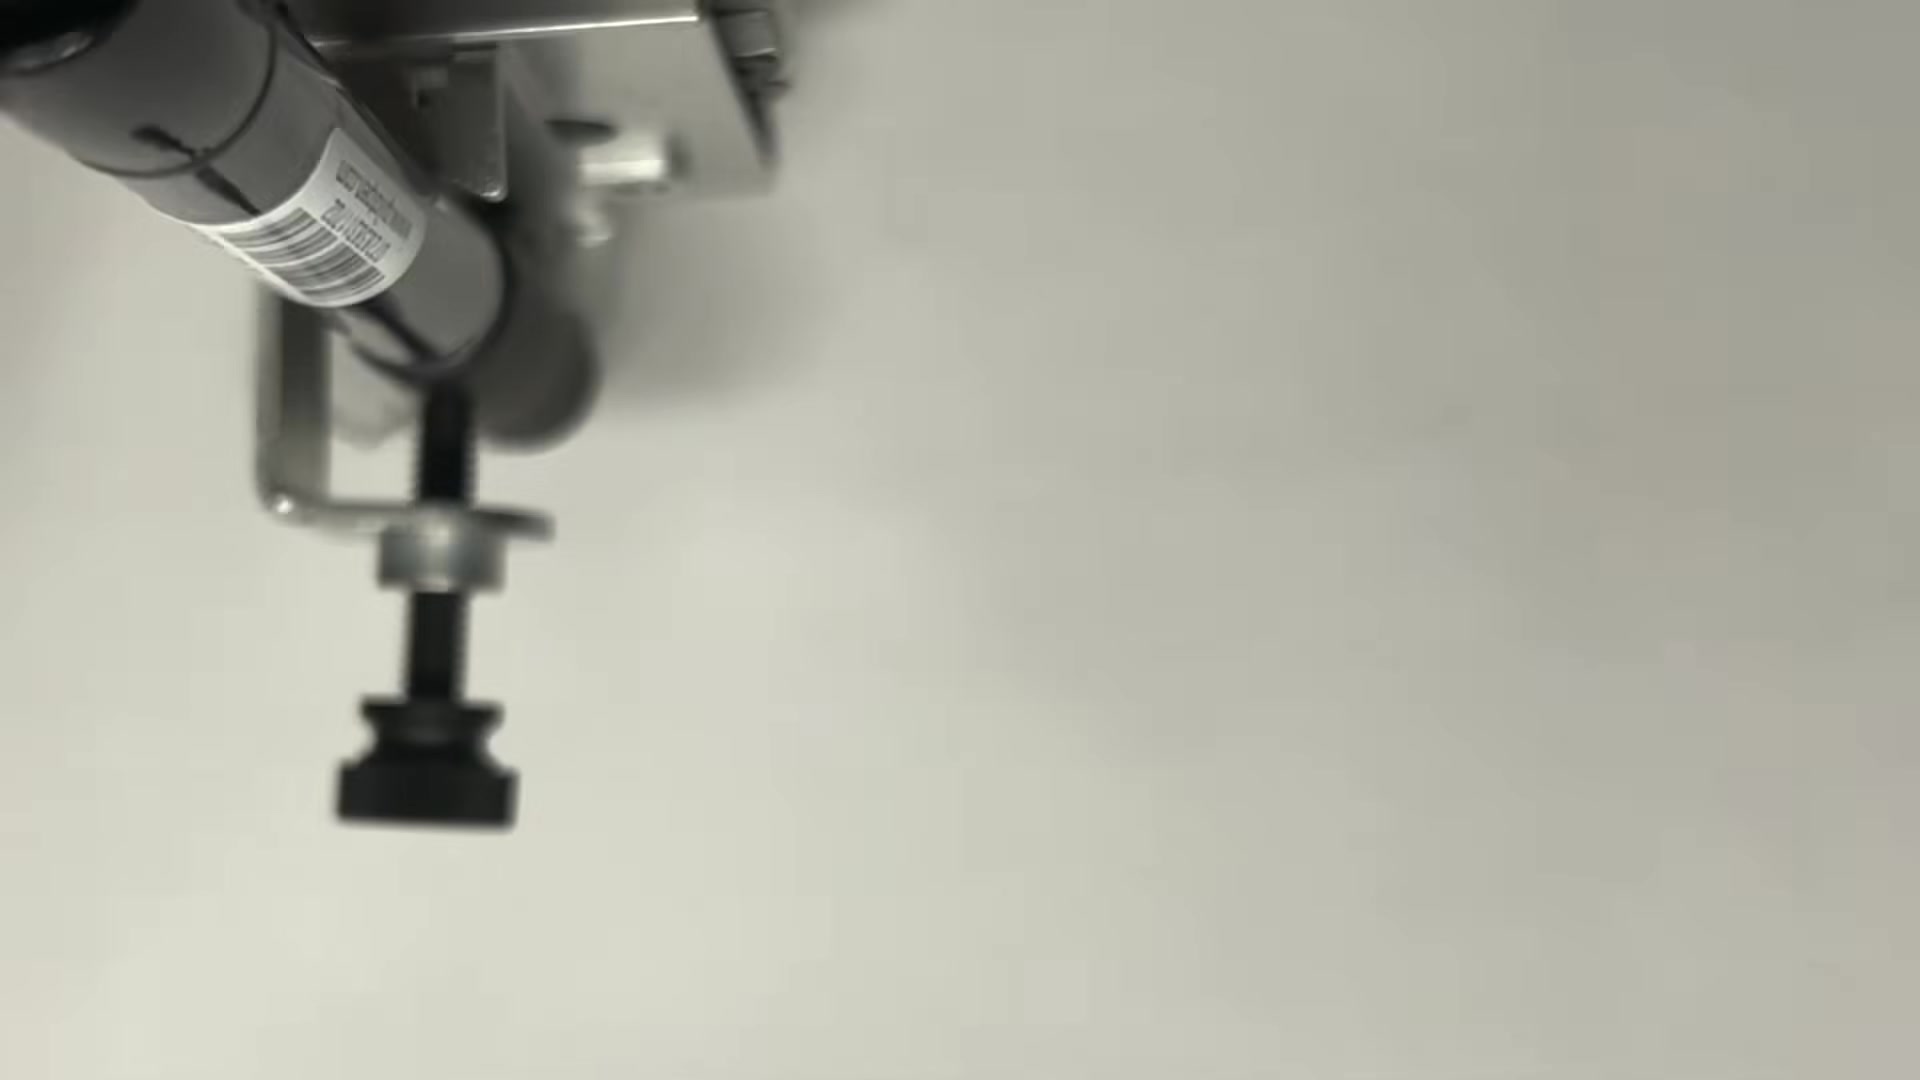
That sheet of paper is the output of the system, and it is what I mean by the “finished piece.” But to me the finished piece is only interesting because of how it was made. The lines are not of a particularly beautiful ratio or curve. What makes them beautiful is that they were generated as the unintended by-product of an incredibly simple intention: move the pen to the ball.
Closed loops
Closed loops have been the focus of this project throughout. In the crumple plotter the loop was one of materials: the thing doing the detecting and the thing doing the recording - input and output - were the same object, the pen nib. That is no longer true of Ball and Line, where the input is the marble and the output is the line drawn by the AxiDraw. Instead, the loop closes between action and reaction.
The marble has a significant radius. The pad reports its position as the center of its contact patch, directly beneath the center of the ball - but the pen can never get closer to that point than one radius away. The seemingly simple and achievable instruction, move to the detected location of the marble, is therefore impossible to carry out. As the pen closes in (action), it strikes the edge of the ball, sends it further away (reaction), and the process begins again: action, reaction, action, reaction, action, reaction, forever.
The crumple plotter was bounded in the scale of its task by the size of the sheet of paper and the size of the pad, whichever was smaller. It started, and within a few minutes it was always over. No such limit applies here. The loop propagates forward in time without limit, and left undisturbed the system would run forever.
The Arena
December 13 - 30, 2024
Forever in theory, at least. In practice the pad is rectangular, and the marble would sometimes jam into a corner with the pen approaching from the opposite diagonal - the plotter rightly following its programming, trying to move further into the corner toward the ball it was pinning there.
Two fixes I rejected
The easiest answer would be to tell the AxiDraw to ease off as it approaches a corner, or to knock the ball once and then move back to let it rebound out. I did in fact implement this, making the pen back away from a corner if it had been stuck there too long - and then I reverted it. There is something wonderful to me about a command as simple as “move toward the ball,” with no caveats attached, producing a perpetual loop. Special-casing the corners would have bought reliability at the cost of simplicity.
The next thought was to remove the corner problem altogether by replacing the rectangular arena I had 3D printed with a circular one. That would have worked, but the circle’s radius would be limited by the shorter side of the pad, which meant sacrificing most of the pad’s sensing area.
The arena that worked
What I built instead solves the corner problem physically rather than in code adding a few bevels.
In plan, the corners are radiused, so that a ball driven into one is deflected along the curve instead of being trapped in a wedge.
In section, the vertical walls are replaced with curved ramps. A ball pinned against an edge can roll up and slightly outward, gaining just enough clearance to travel around the pen and back out into the open.
Together these let the pen’s goal stay maximally simple - always move toward the marble, no exceptions - while keeping the loop perpetual.
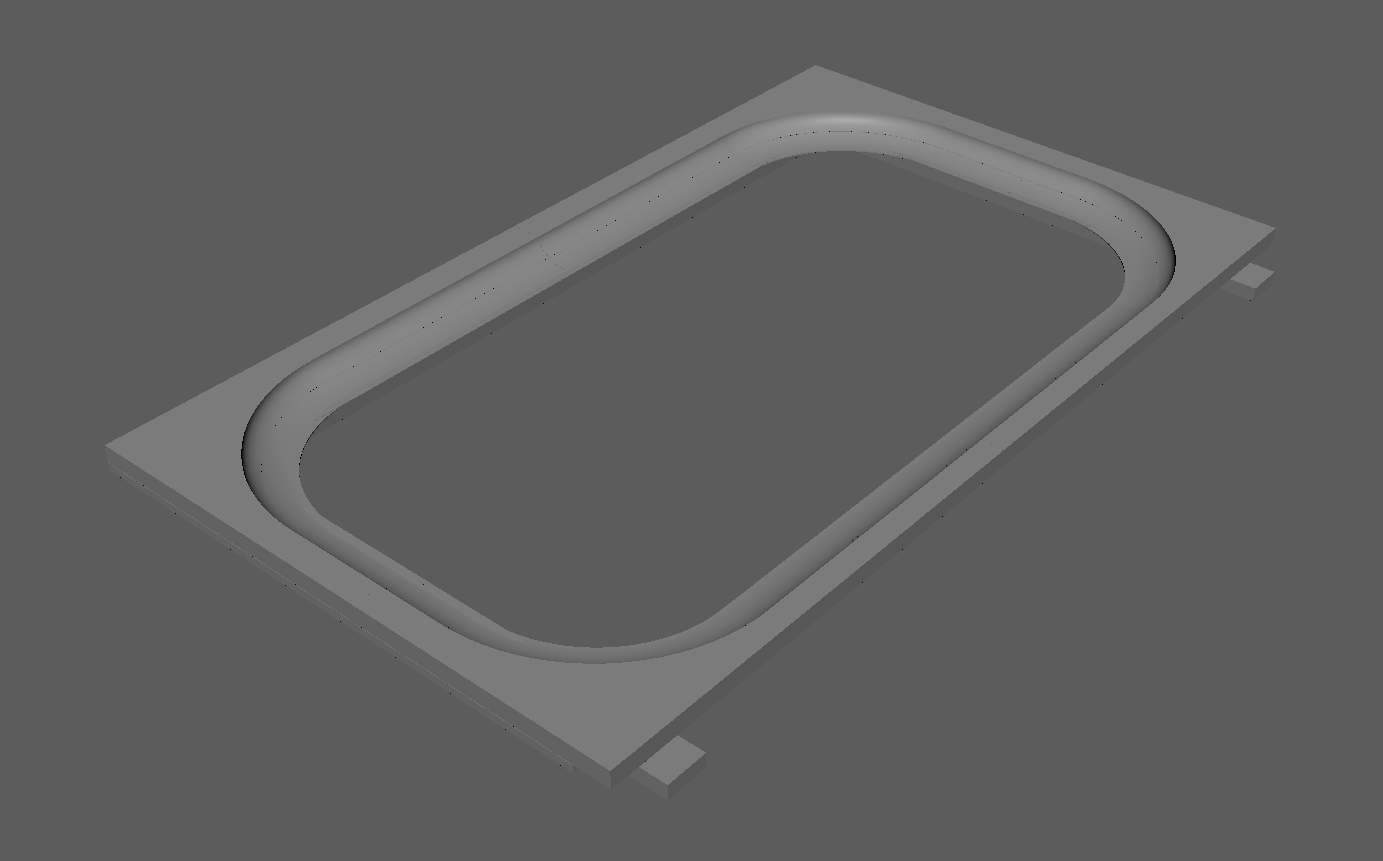
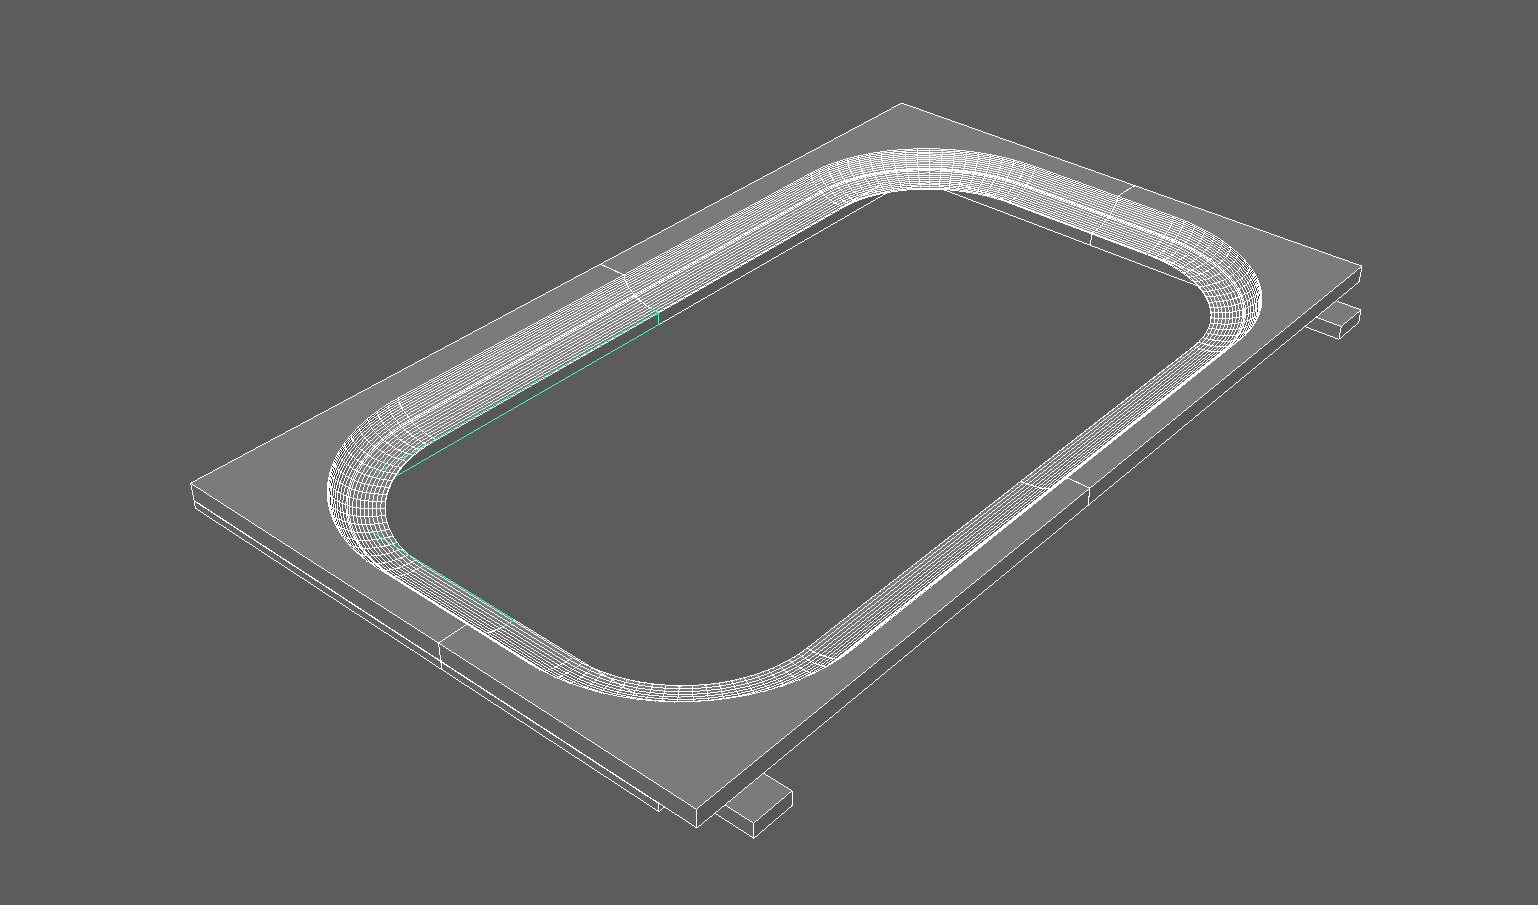
The arena, printed in two halves. The model is on GitHub.
Patterns That Emerge
December 2024
I have always loved visualizations of large data sets. Accumulate enough individual events and patterns start to appear that no single event would reveal - the eye picks them up and understands them intuitively, often before you can articulate what you are seeing.
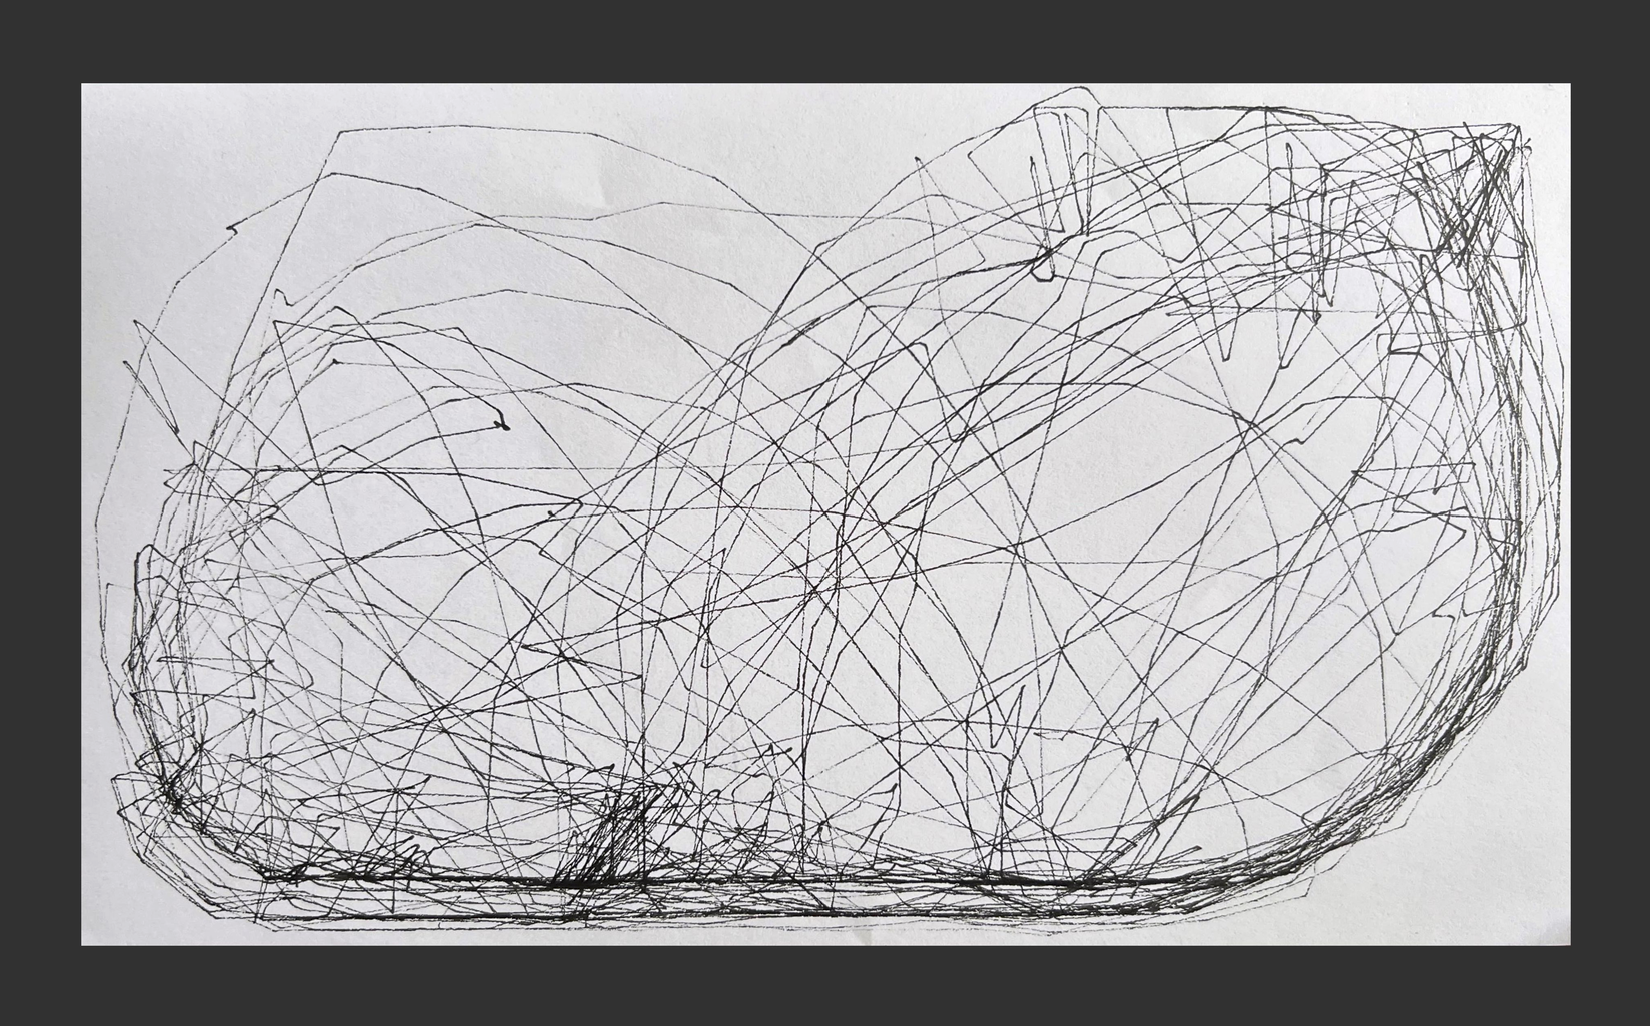
Ball and Line accumulates in the same way. Each movement of the pen is one event, and a finished sheet is thousands of them laid over each other. Regularities in how the ball tends to move show up on the page as density.
Magnetic points
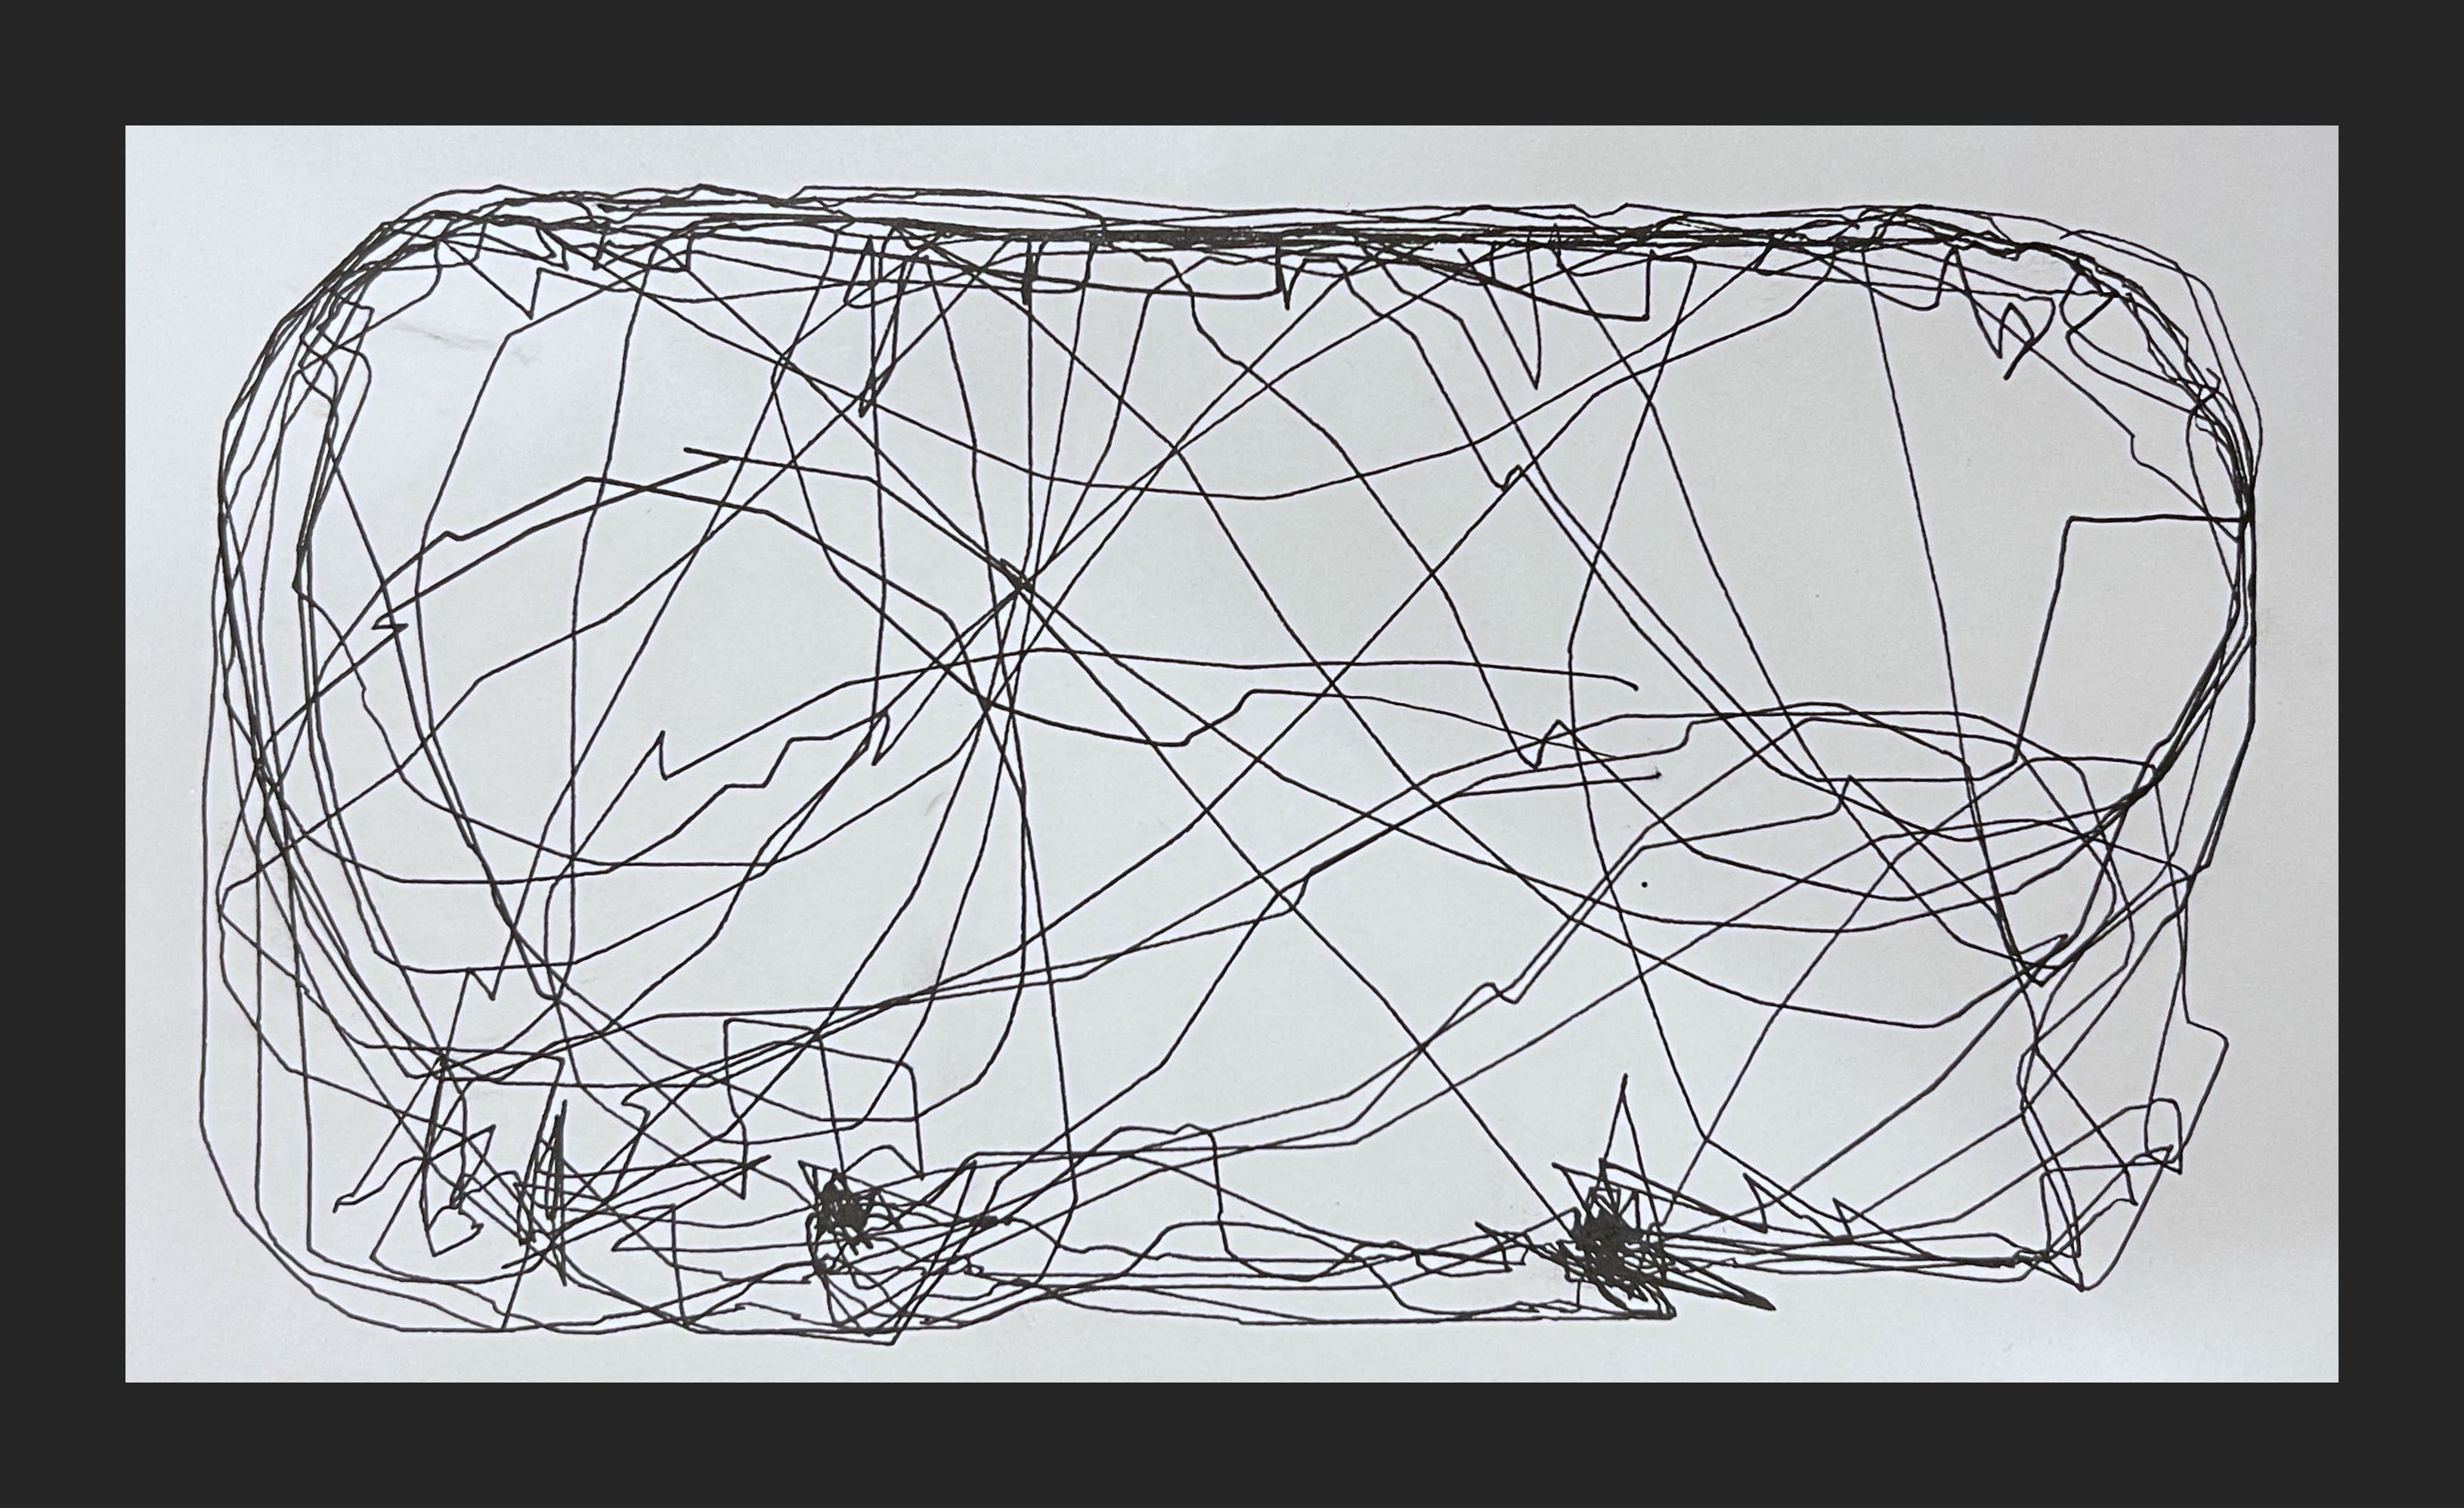
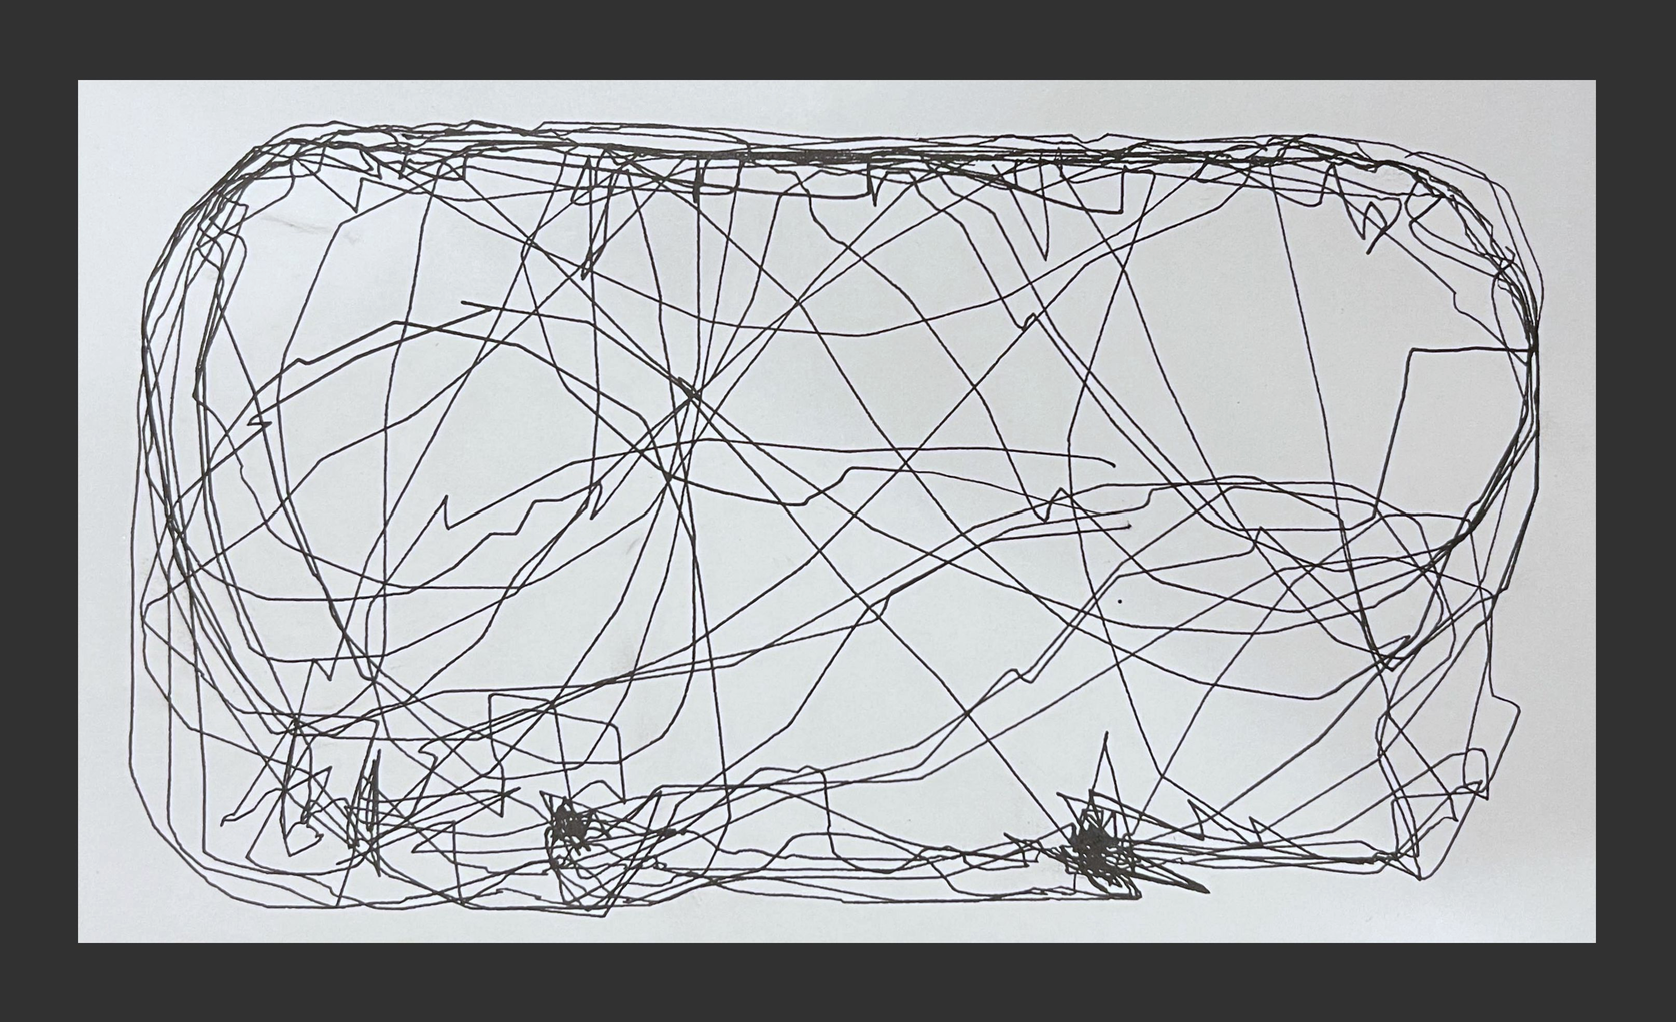
Here I replaced the tungsten sphere with an iron one. Two magnetic points near the bottom of the pad divert the ball toward them again and again, and both appear on the page as dense knots where the chase repeatedly converged.
Tilt
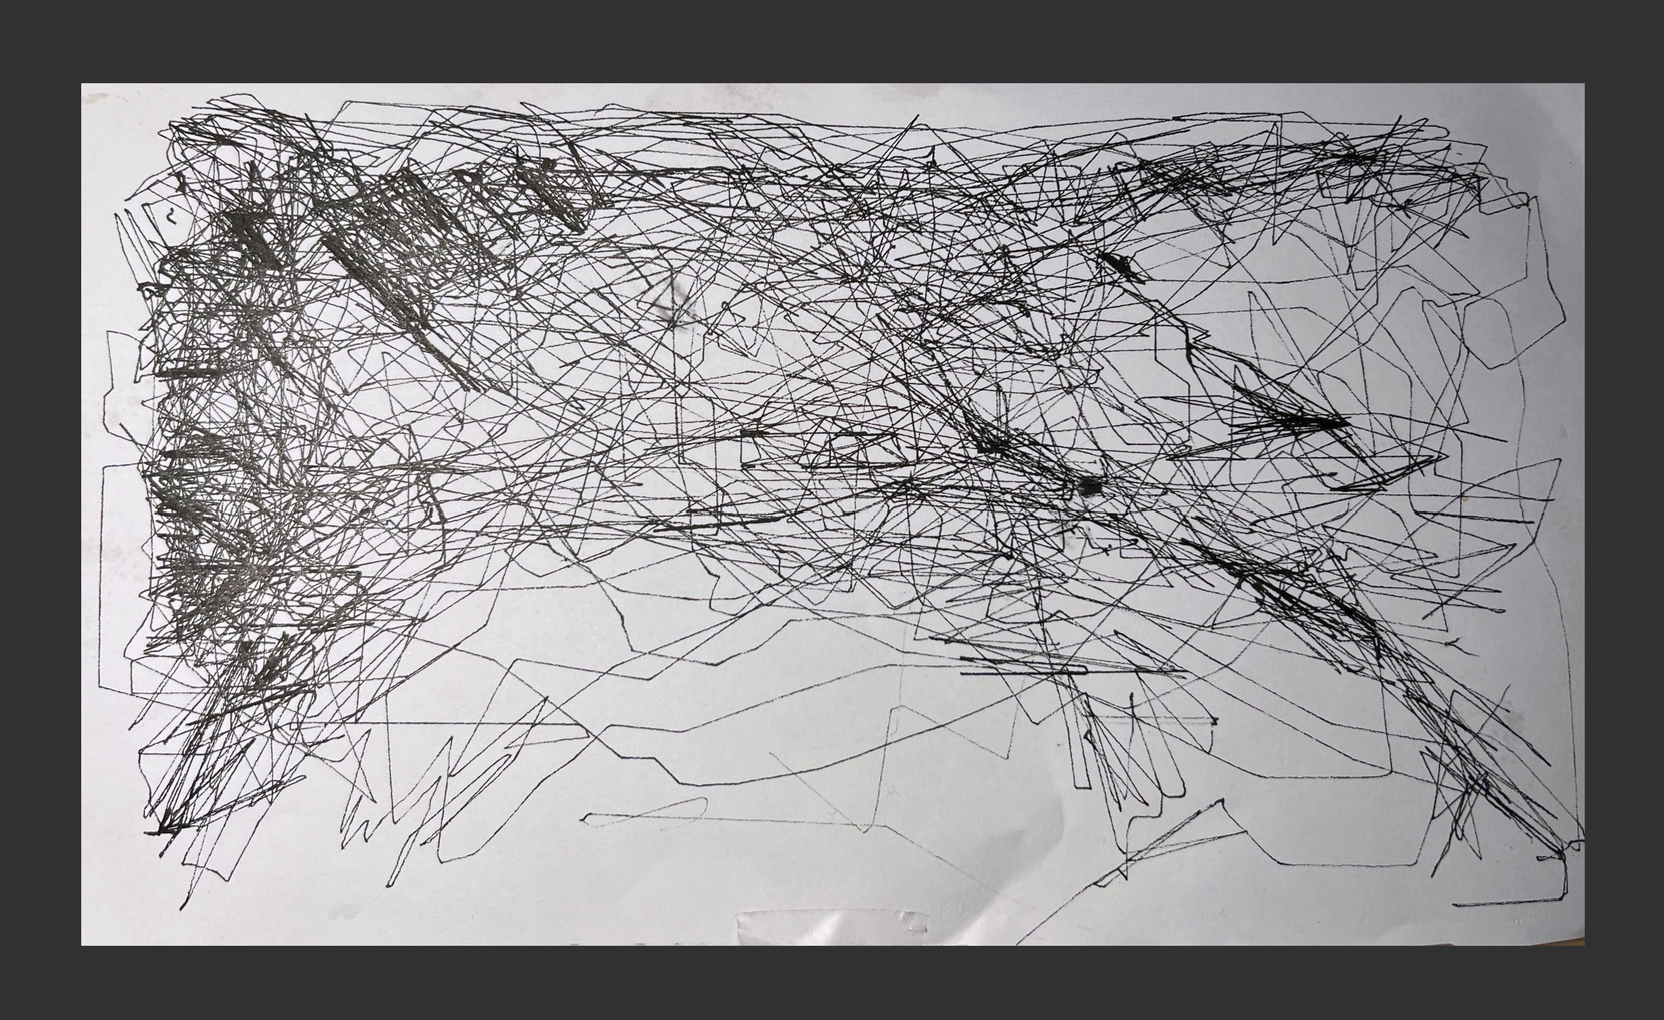
During the final demonstration of the piece I was too focused on making sure everything was working correctly, and neglected to properly level the table. I am glad of it, in the end - the resulting piece tells you something about the conditions under which it was generated. The ball spent most of its time on the low side, and the drawing is heavy there and thin everywhere else.
Corners
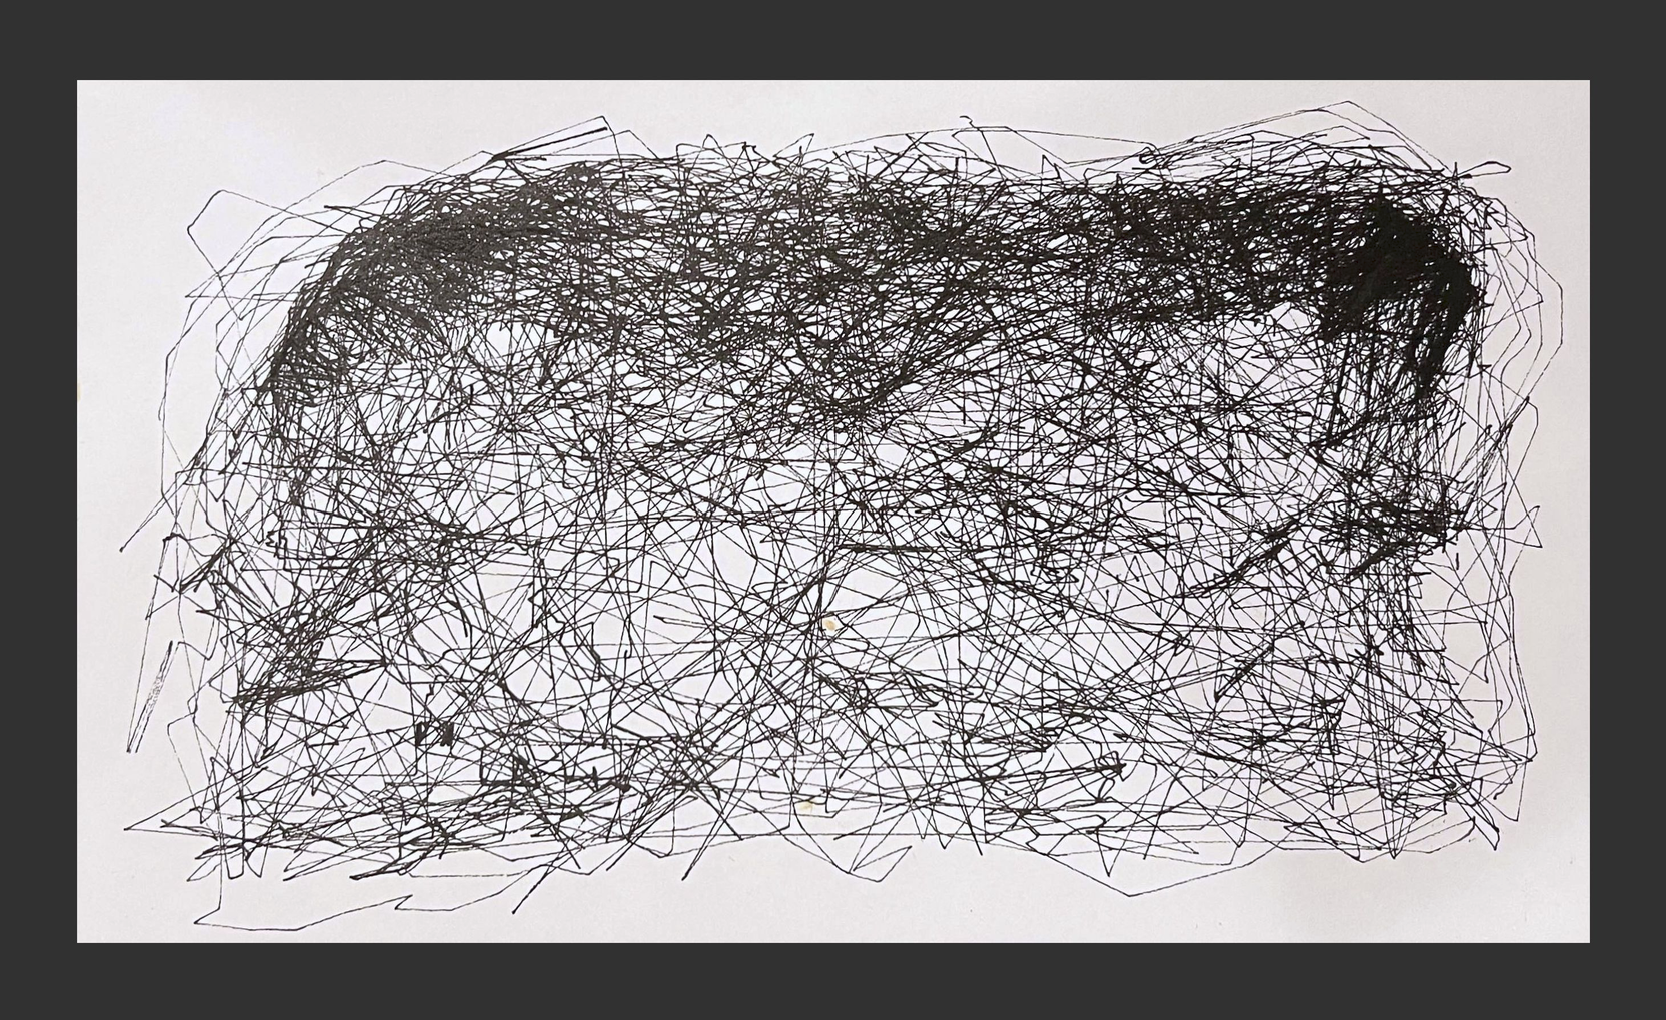
The marble no longer gets permanently stuck in the corners, but it will still dwell there. It can take a fair amount of wobbling before it escapes, and if that is compounded with a slight tilt lowering one corner relative to the others, you can end up with a corner where the ball spends much of its time.
Stable loops
To me this is the most interesting outcome. On this particular run, for whatever reason, the ball fell into a semi-stable figure eight and held it. The pattern that created the piece is directly legible in the finished piece - which is the tie between process and result that the whole work is about.
Why Not a Camera?
When a piece is built on an unusual technology, it matters that the technology is not a gimmick - that there is a real, substantive reason not to have used the more standard or more efficient means.
For this system, the obvious standard approach would be to mount a camera above the AxiDraw and use it to find the marble, perhaps painted a bright color, in place of the pad. There are a number of problems with that.
The most direct is occlusion. What happens when the marble passes under the arm of the AxiDraw? From above it disappears completely. It is possible to work around this by estimating the ball’s position from its last known trajectory, but that adds enough complexity and uncertainty that occlusion alone is sufficient reason to use the pad instead.
The second reason is not practical but conceptual, and in my opinion it is even more important. It is strange to watch the AxiDraw follow the marble around with no visible sign of how it knows where the marble is. You almost expect to see a camera hunched over a system like this, and the absence of one is wonderful. It gives the system a sense of aliveness and intention - it feels as though the plotter itself is batting the ball around, rather than a computer, an input sensor and a plotter all wired up and executing code. The drawing machine reads as the thing that is alive and intentional, not as one dumb component of a larger system.
Stopping
Despite all of my claims about maximal simplicity, there is one other rule in this system - and it is not one the plotter follows.
“Move the pen to the marble” is the only rule the plotter follows, and it has no terminating condition. Left alone, the loop would run until the AxiDraw broke down. And yet every piece shown above did somehow finish.
They are finished because somebody decided they were. The drawing itself is made entirely without intention - it is the by-product of a ball and a pen failing to meet, over and over. The one intentional act in the whole piece belongs to the person watching it happen: choosing the moment to stop, and in doing so deciding when the drawing is finished. Everything else is the consequence of a rule the machine cannot help following. The only decision in the work is when it ends.
What It Became
December 2024
Originally, the crumple plotter set out to make a sheet of paper record its own topography, and it failed for a specific and instructive reason. I was asking a sensor built to locate presses to make a fine distinction at the bottom of its force range, and what it gave back instead was a faithful, perfectly repeatable picture of its own unevenness. What survived that failure was the most interesting concept of that first attempt - the in-place record, a material that is both the source of a phenomenon and the surface that visualizes it.
Ball and Line is that sensor used as simply as possible. The pad reports where the marble is. The plotter moves the pen there. Because the pen can only ever reach the ball’s edge, arriving means knocking it away, and the task immediately renews itself. The pen never lifts, so the entire chase is drawn.
Making the chase perpetual was a challenge that I solved without any code - an arena with its corners radiused in plan and its walls ramped in section, so that a ball driven into a corner rolls back out instead of pinning there. That is what let the rule stay uncaveated.
What accumulates on the page is not designed. It is the residue of a task that cannot be completed, and it records the conditions it was made under: a table left slightly tilted, a pair of magnets, a corner the ball was likely to roll into, a figure eight it happened to fall into. The only intentional decision in the piece is when to stop.
The code and the arena model are on GitHub.
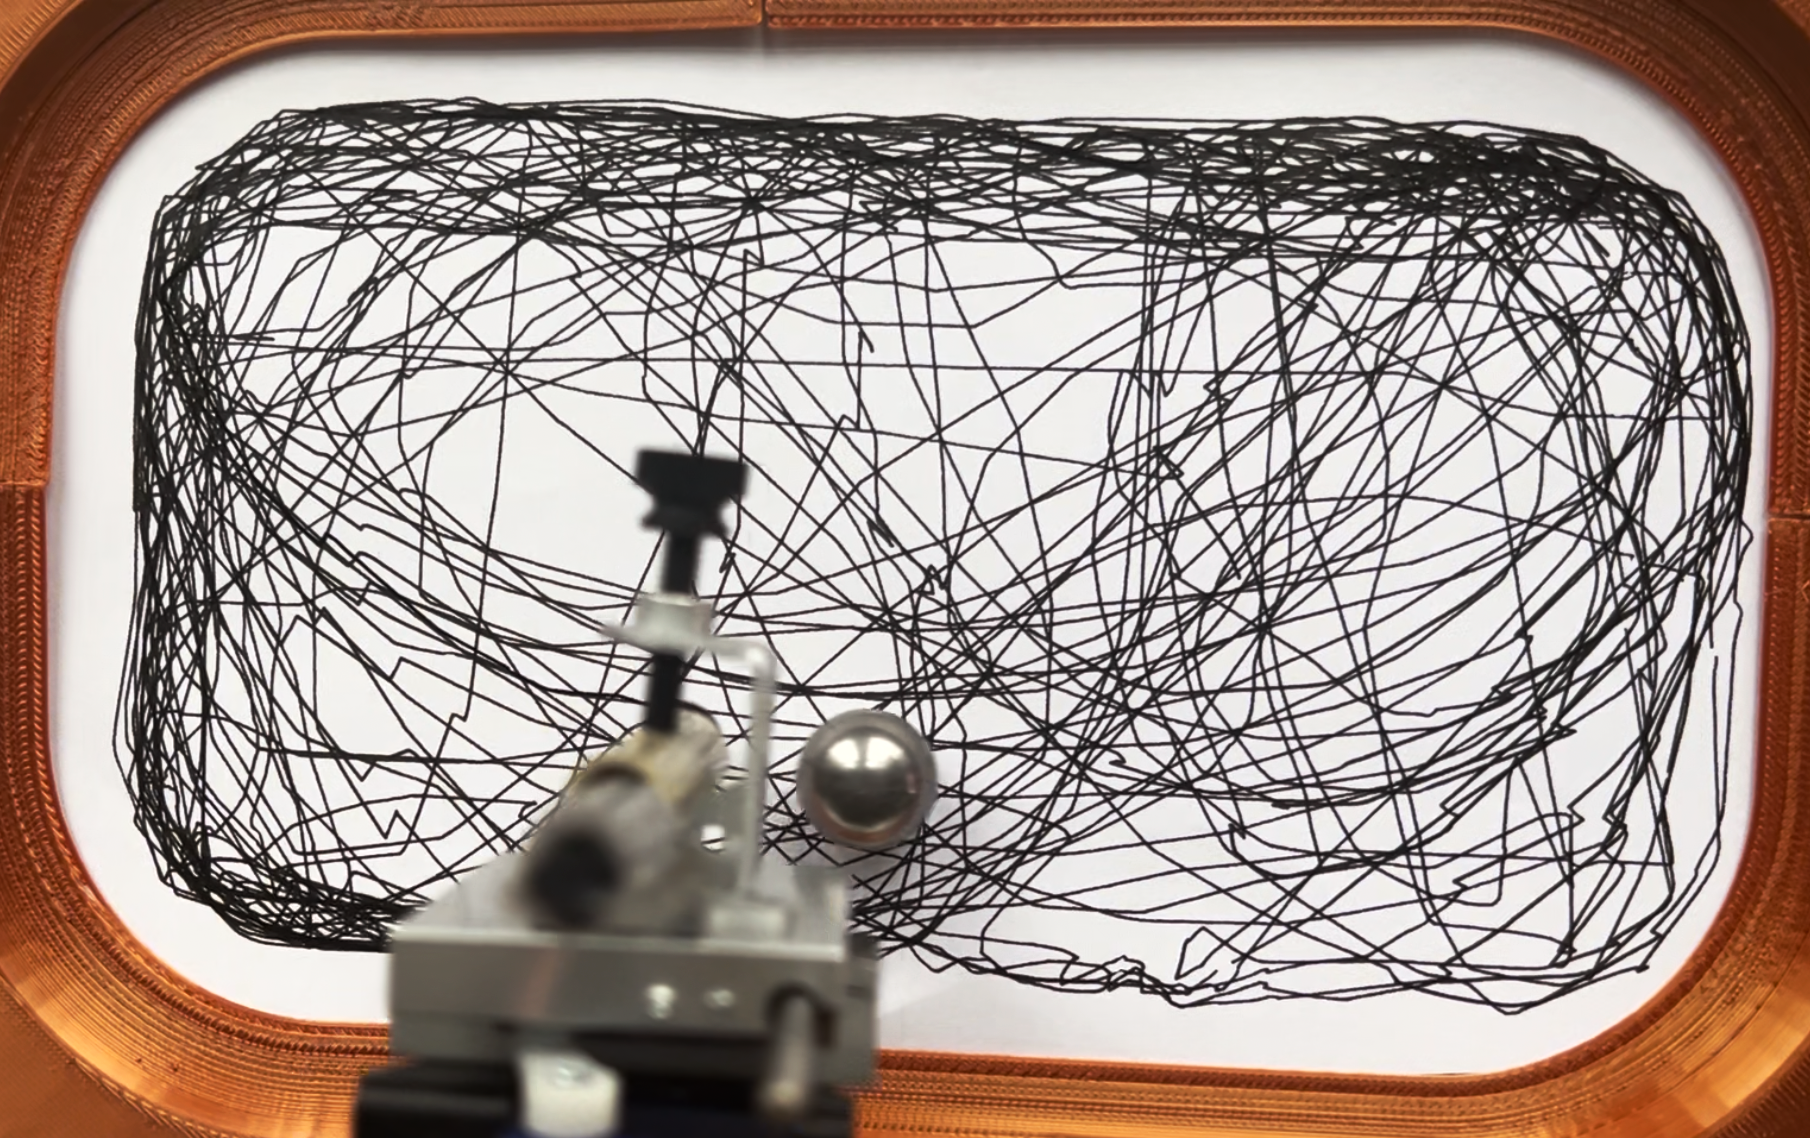
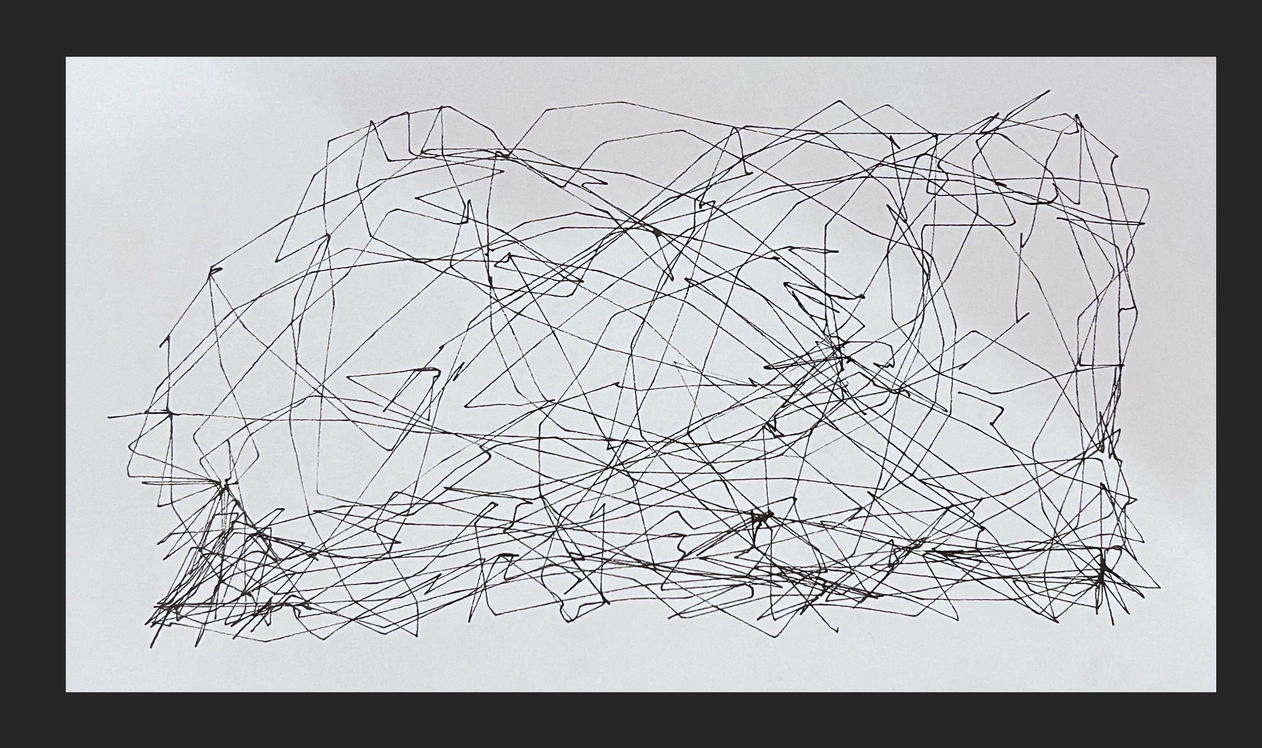
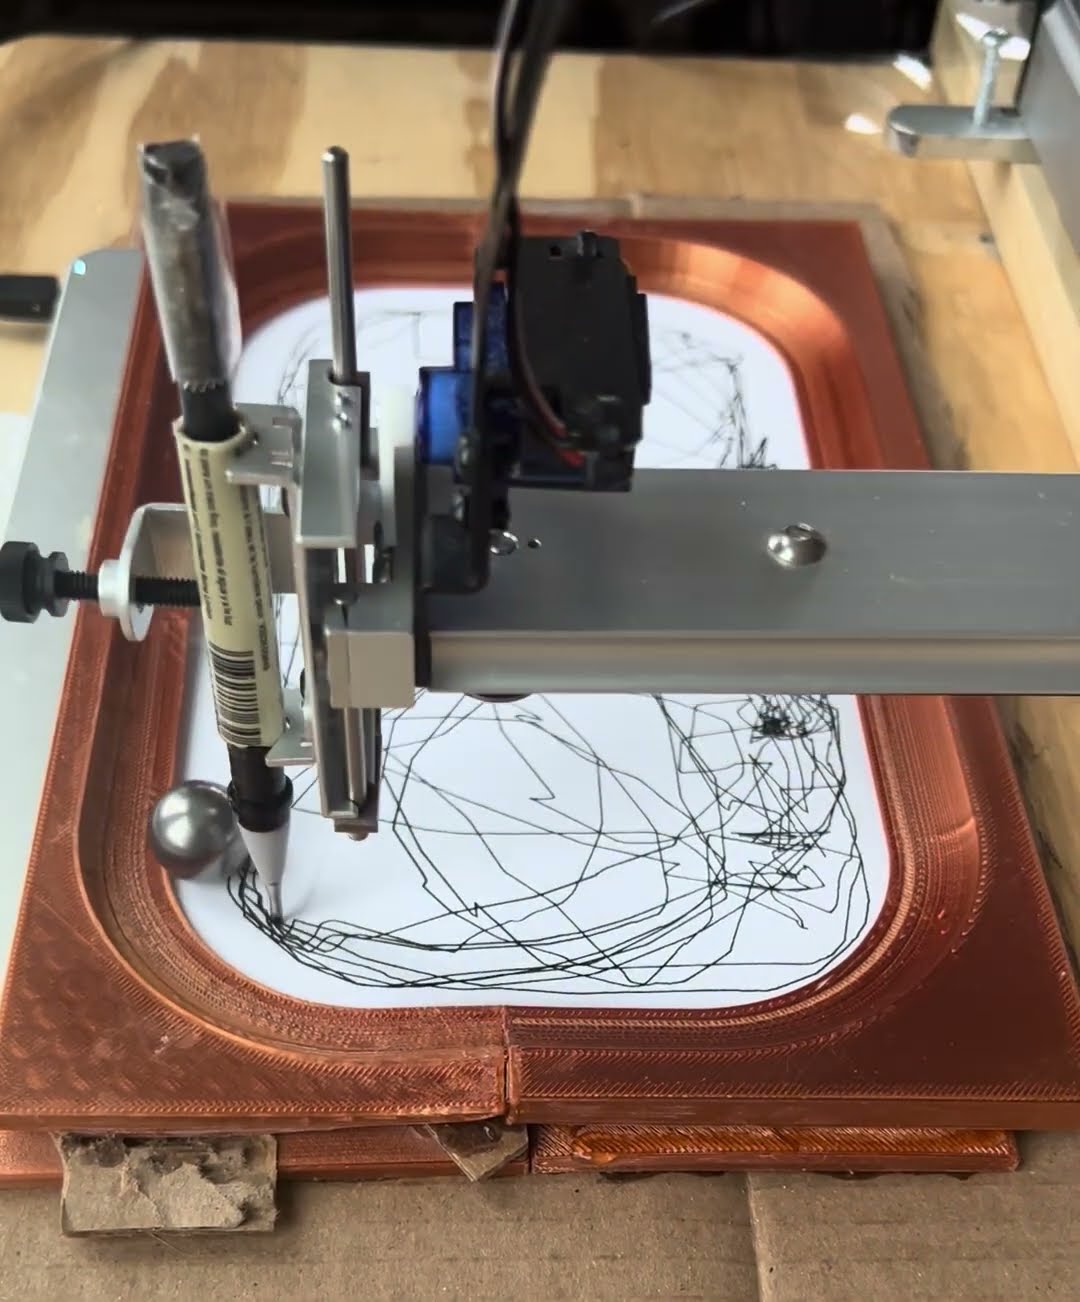
The system running.